
Microsoft Defender for Endpoint in Action: Onboarding, Detection, and Response
Introduction
What happens when one of your corporate endpoints starts behaving suspiciously, and how quickly can your security team detect, investigate, and contain it?
Endpoints are often where attacks first become visible. A malicious process, suspicious PowerShell activity, credential theft attempt, or unexpected network connection can all be early indicators of a broader compromise. Without sufficient endpoint visibility, these signals can easily be missed until the attack has already progressed.
This is where Microsoft Defender for Endpoint comes in. It provides endpoint detection and response capabilities that help security teams monitor devices, detect suspicious behavior, investigate alerts, and take remediation actions from the Microsoft Defender portal.
In this hands-on article, I will walk through a practical Defender for Endpoint scenario, from device discovery and onboarding, to generating security telemetry, investigating detections, and responding to a potential threat.
The goal is not simply to reproduce a lab procedure, but to understand what Defender for Endpoint is doing behind the scenes and how these capabilities fit into a real Security Operations workflow.
ToC
Preparation and Onboarding
Before Microsoft Defender for Endpoint can investigate suspicious activity on a machine, the endpoint first needs to become part of the Defender environment. I therefore started by checking Device discovery in the Microsoft Defender portal. Under the Defender settings, make sure Standard discovery is enabled.
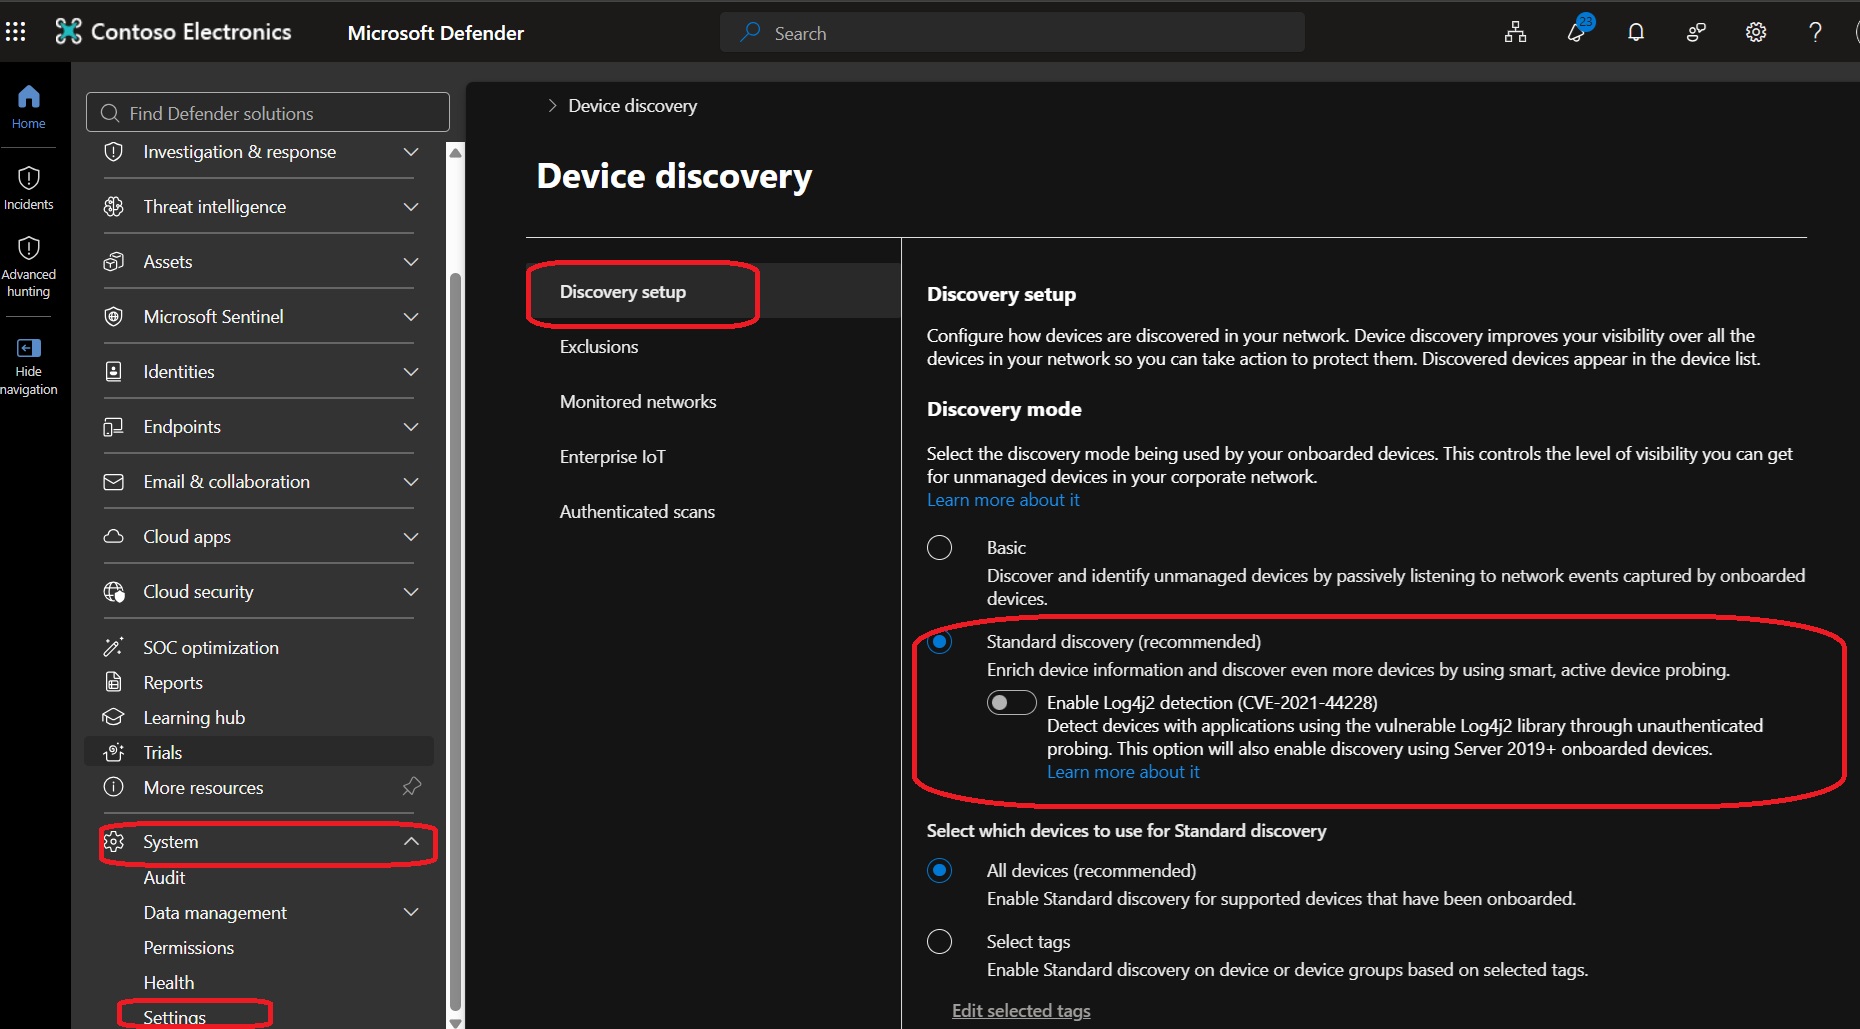
Device discovery is particularly useful because the security boundary of an organization rarely ends with the endpoints that administrators already know about.
Onboarding the First Windows Endpoint
The onboarding experience is available from Microsoft Defender portal -> System Settings -> Endpoints -> Onboarding.
For this implementation, the target was a Windows 10/11 machine.
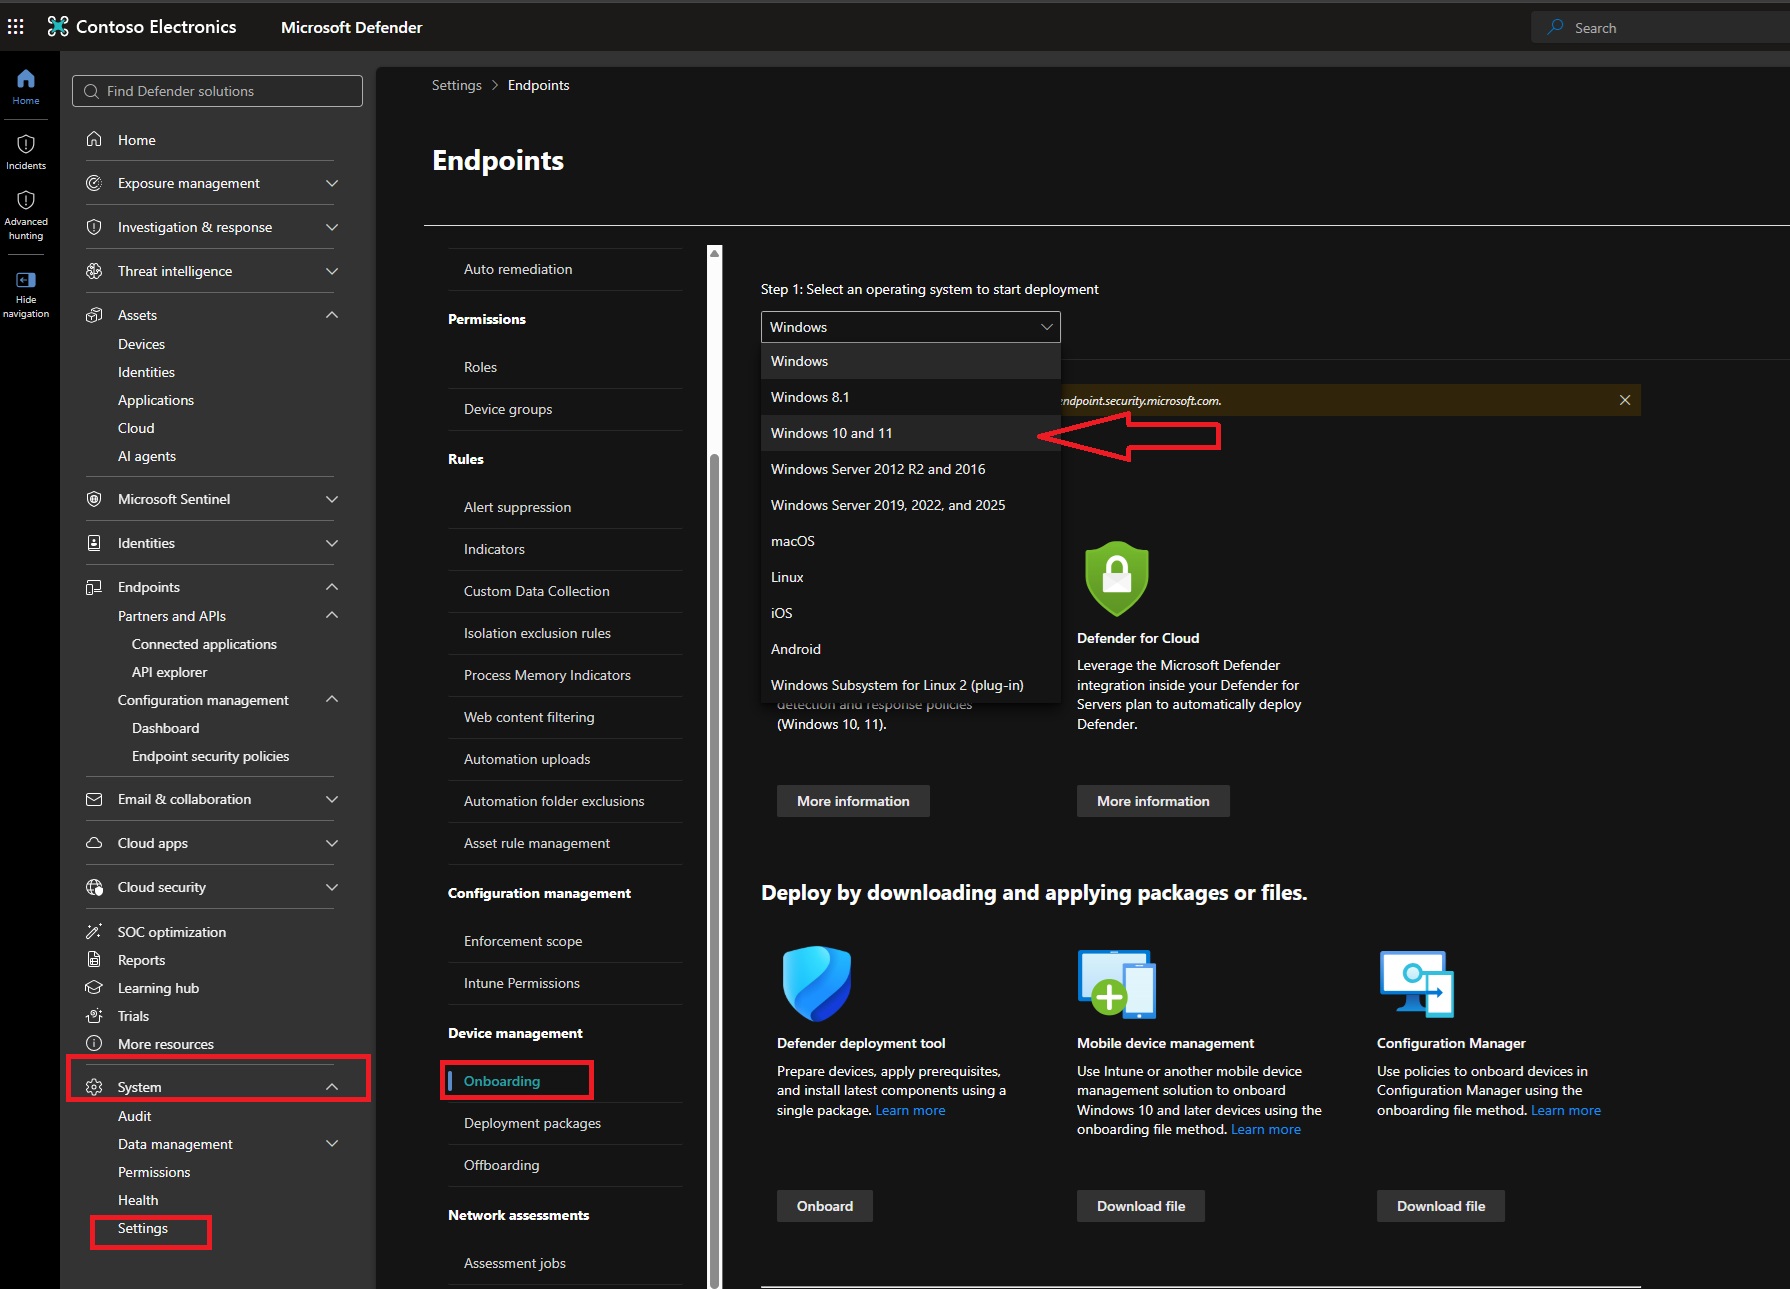
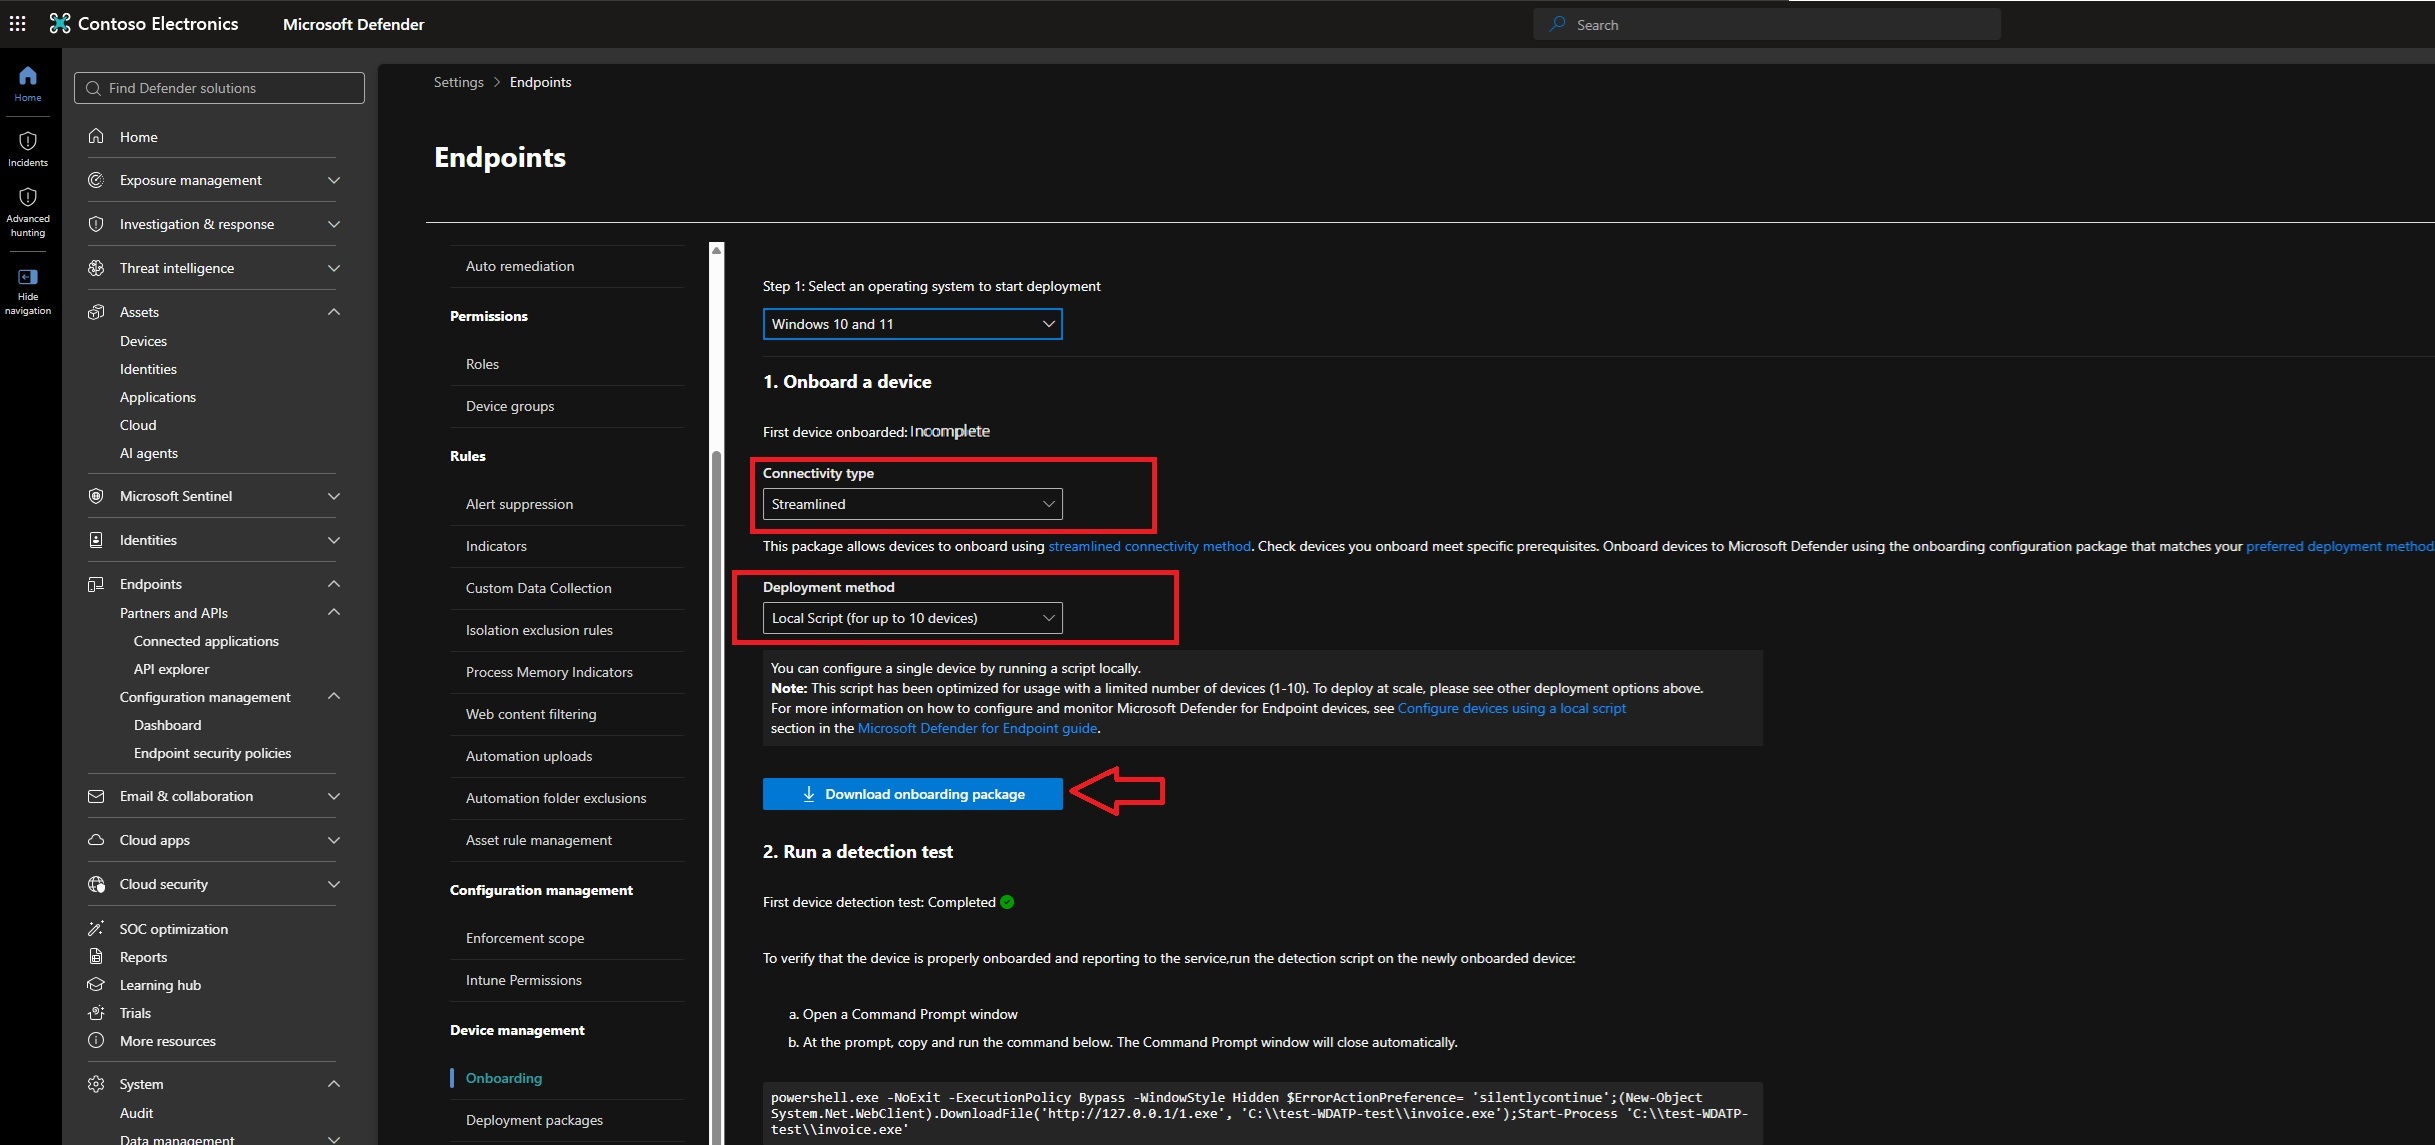
I selected:
- Operating system: Windows 10 and 11
- Connectivity type: Streamlined
- Deployment method: Local Script
The choice of Streamlined connectivity is worth calling out. Instead of requiring connectivity to the traditional larger set of Defender for Endpoint service URLs, Microsoft provides a streamlined connectivity model that consolidates communication through a reduced set of endpoints. This simplifies firewall and proxy configuration without changing the Defender for Endpoint functionality available to the device.
For a hands-on implementation like this one, the Local Script method is also convenient because there is no need to introduce a device-management platform purely for the onboarding exercise.
Running the Onboarding Package
After downloading the onboarding package, I extracted it on the Windows machine and ran the included onboarding script with administrative privileges.
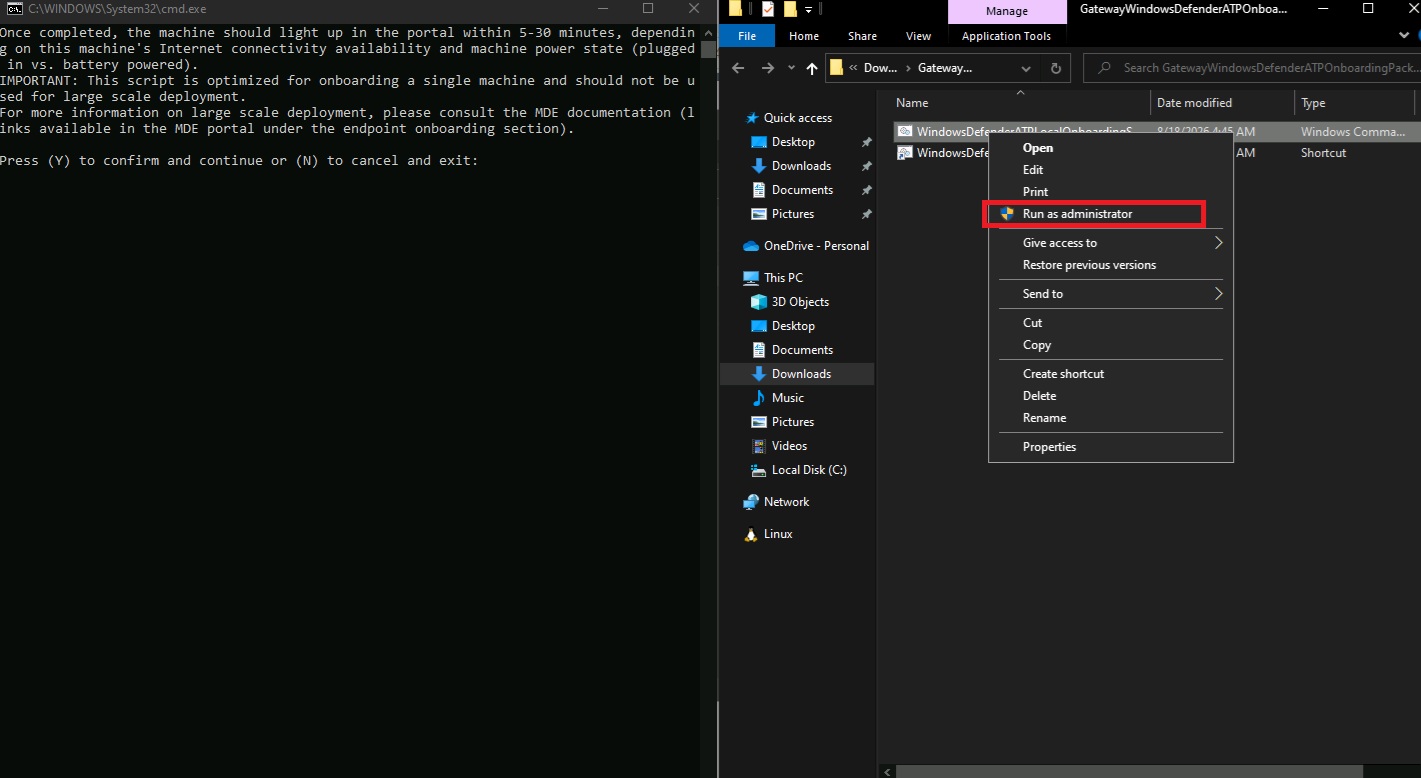
The script asks for confirmation before applying the Defender for Endpoint onboarding configuration.
The real objective is to establish the telemetry path:
- Windows endpoint
- Defender for Endpoint sensor
- Microsoft Defender cloud service
Once that relationship is established, endpoint activity can start becoming visible to Defender and can later be correlated with detections and incidents.
The onboarding process is not necessarily reflected in the portal immediately, so after running the script I allowed some time for the device to begin reporting.
With the endpoint now connected, the environment was ready for the next operational step: defining how Defender should treat that device population.
Creating a Device Group
Device groups provide flexibility to apply different automation levels to different endpoint populations. In this hands-on environment I used Full remediation, but in production the remediation level should reflect the organization's operational and security requirements.
Onboarding a device gives Defender for Endpoint visibility into what is happening on it. The next question is what Defender should be allowed to do when it actually finds something malicious.
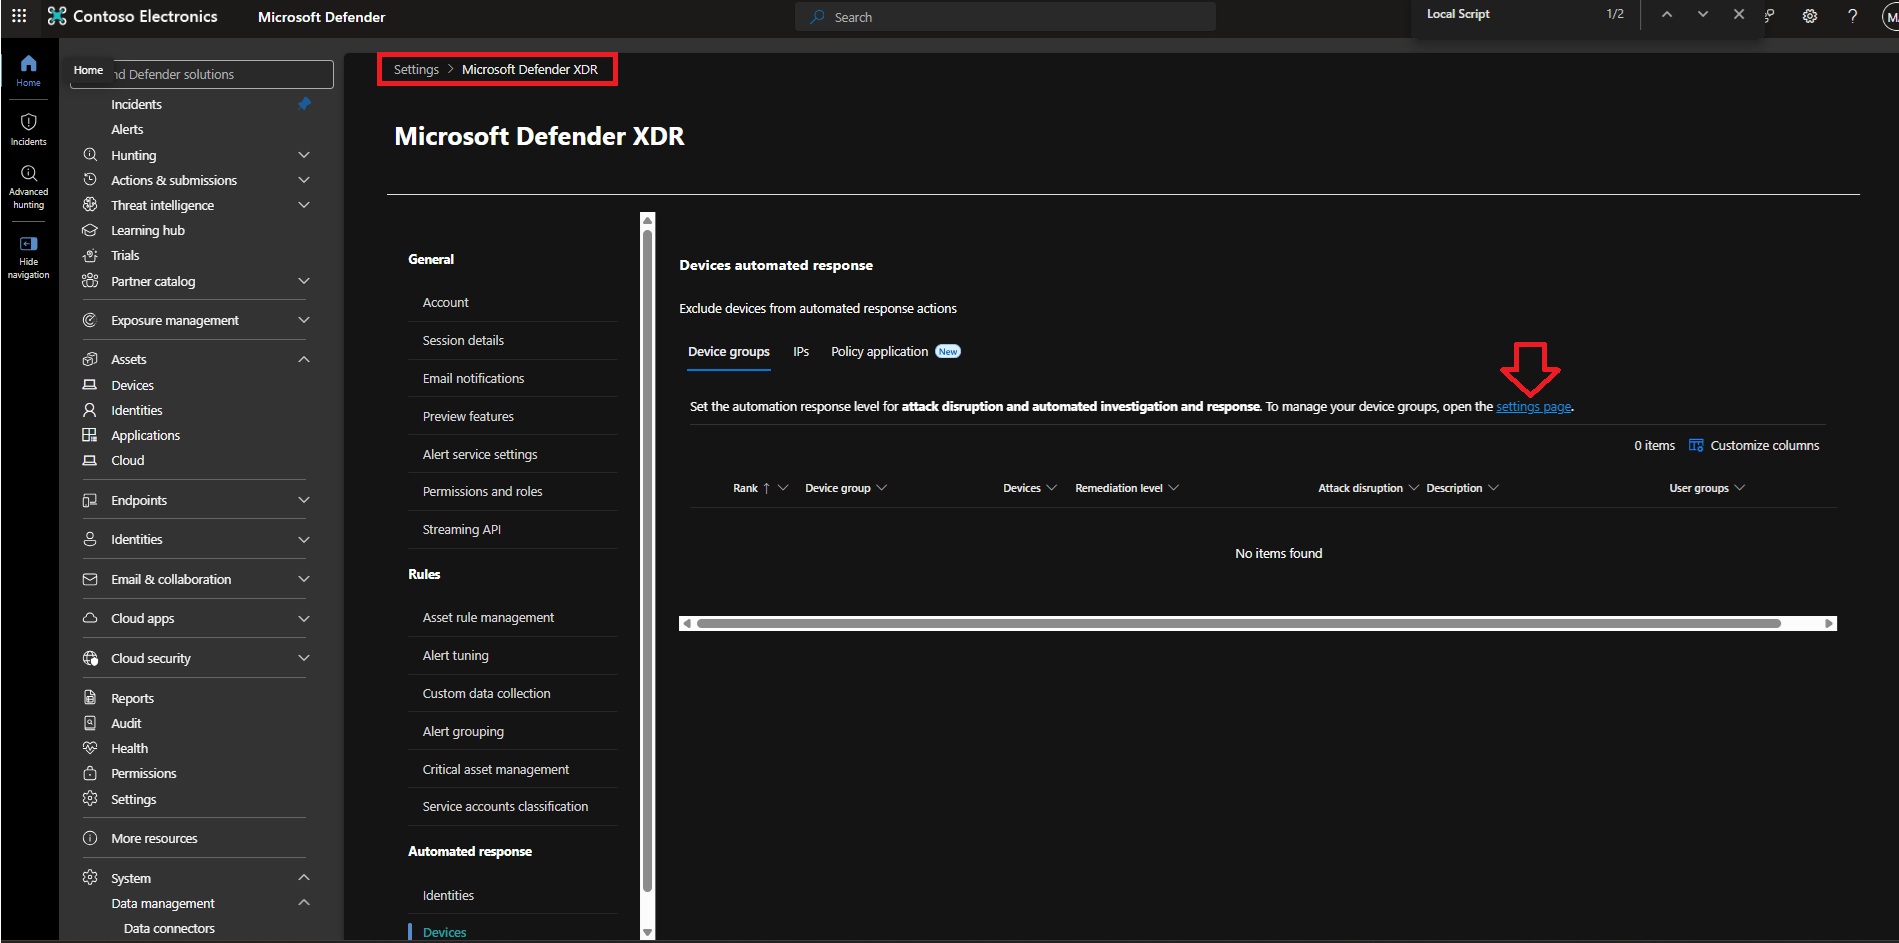
You can find the Device groups section under System -> Settings -> Microsoft Defender XDR.
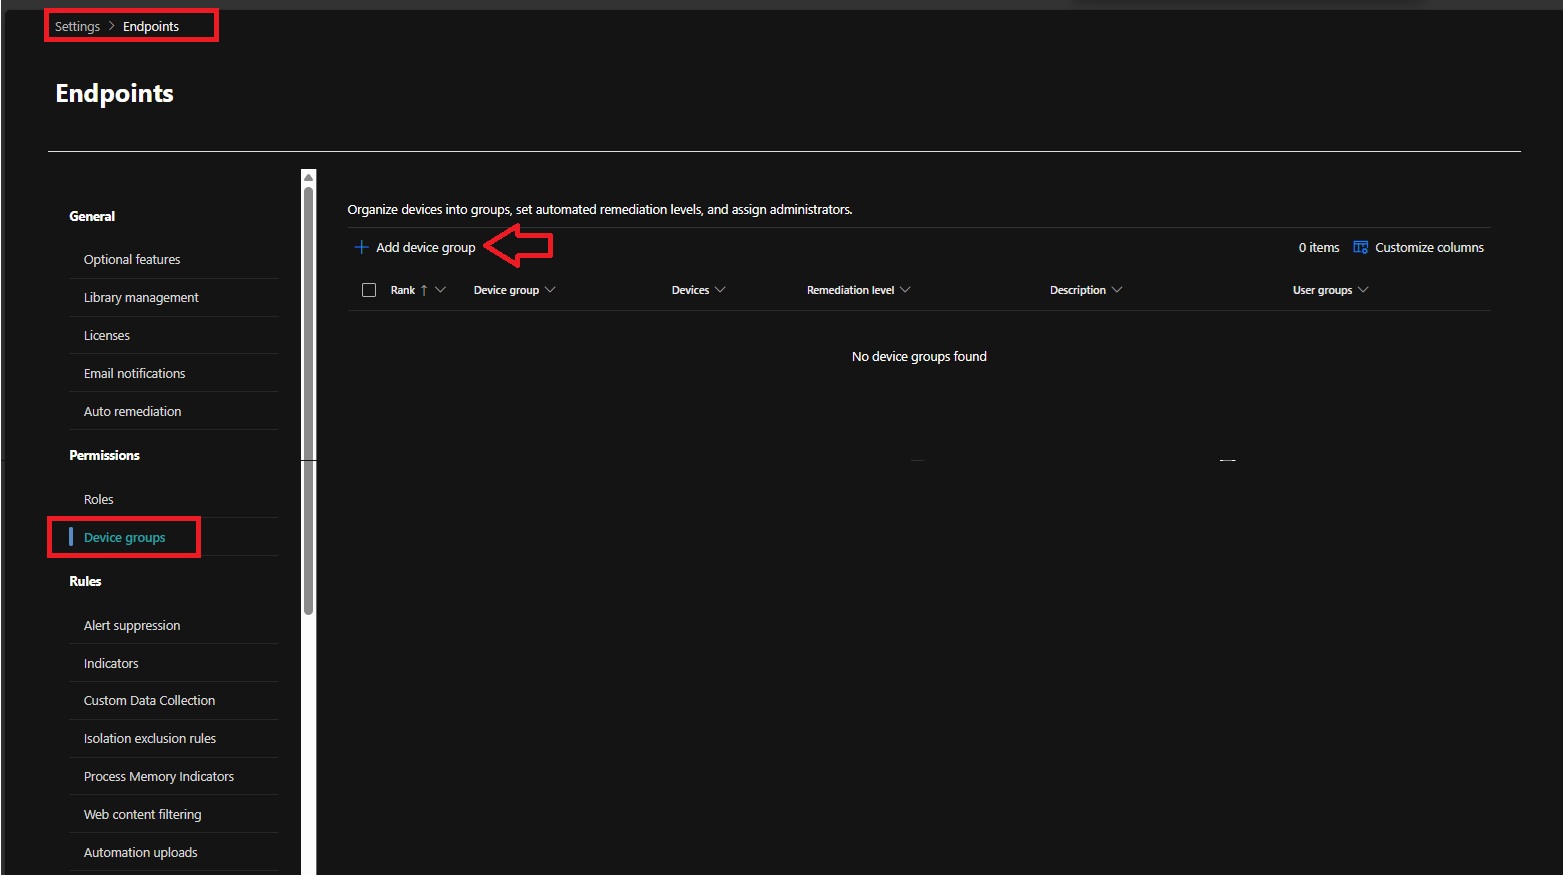
Device groups in Defender for Endpoint can serve several purposes, including organizing endpoints, scoping analyst access, and, most importantly for this scenario, setting different automated remediation levels for different groups of devices.
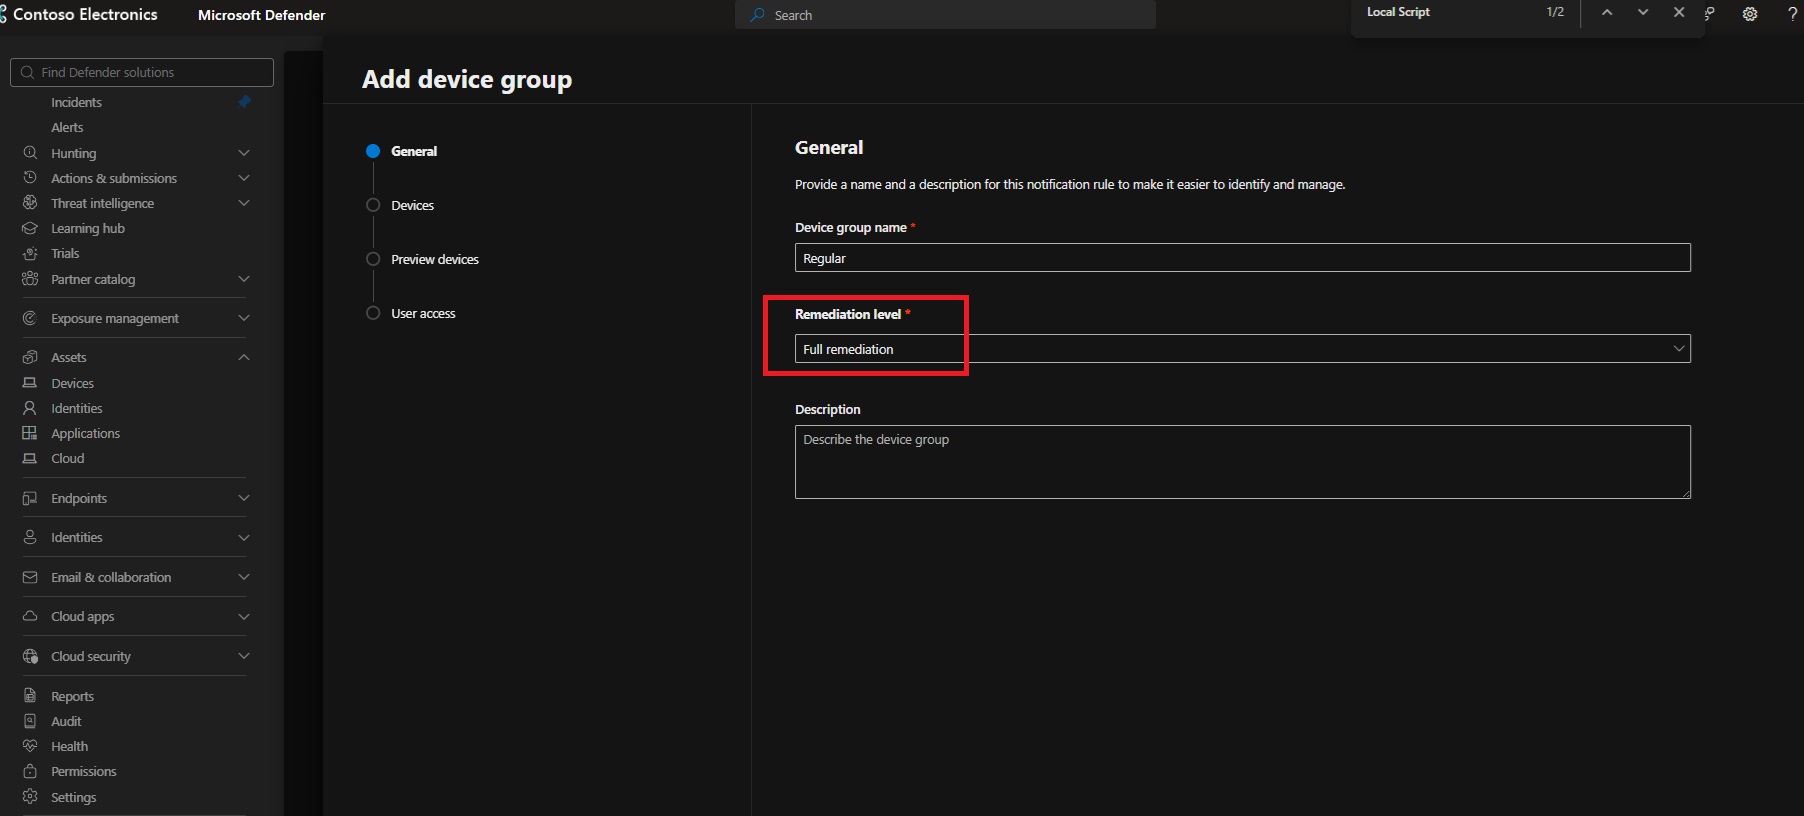
With Full remediation, Defender can automatically perform remediation actions when an automated investigation determines that an artifact is malicious, rather than waiting for an analyst to approve every action. Those actions are still tracked in the Action Center, where the SOC team can review what Defender performed.
I used an operating-system matching rule so that the Windows test machine would become a member of this group.
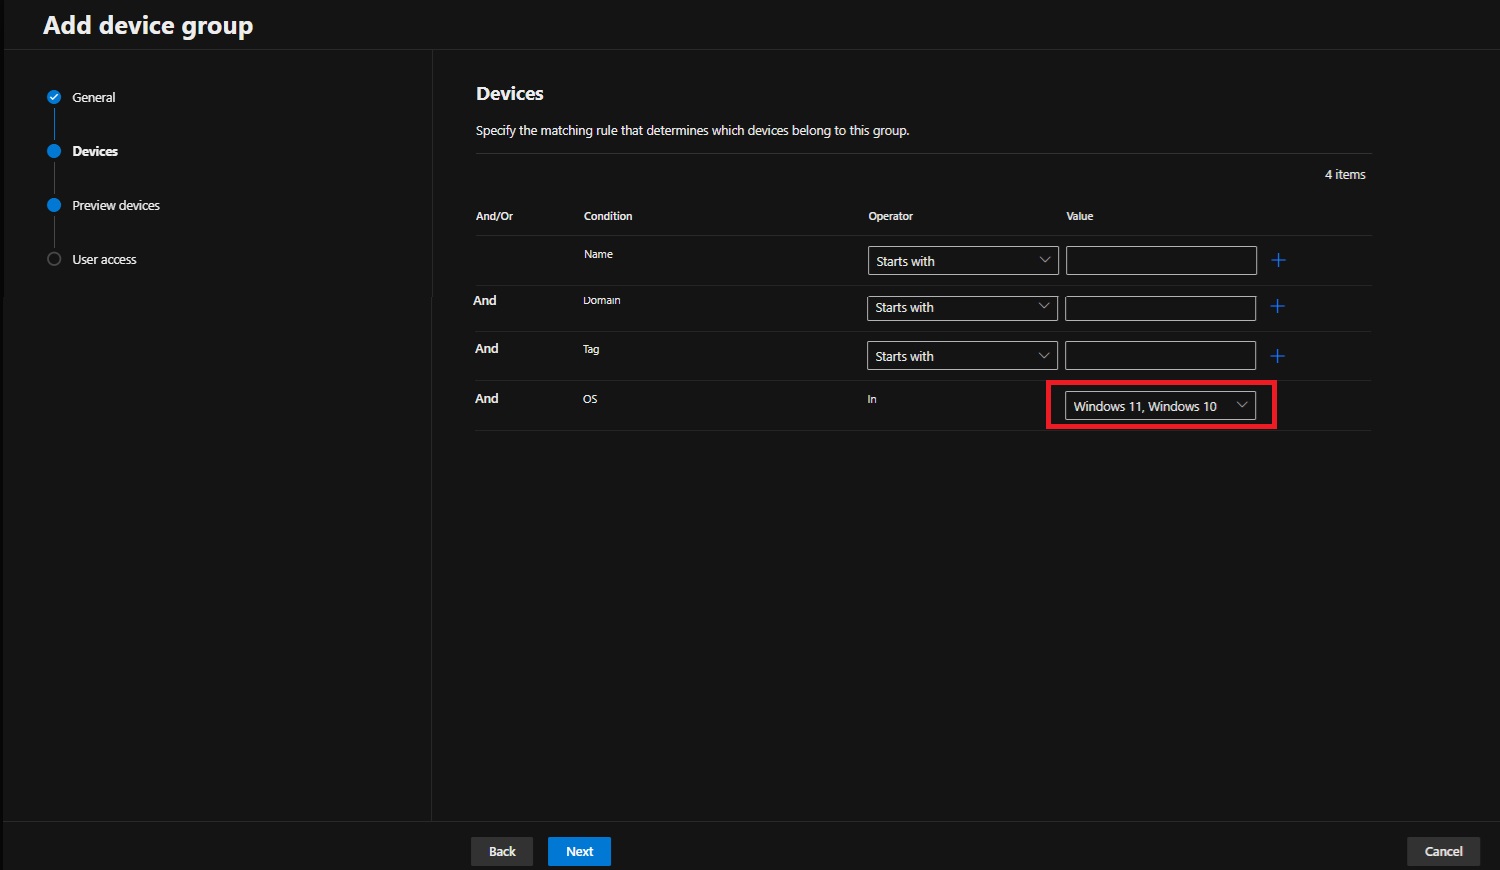
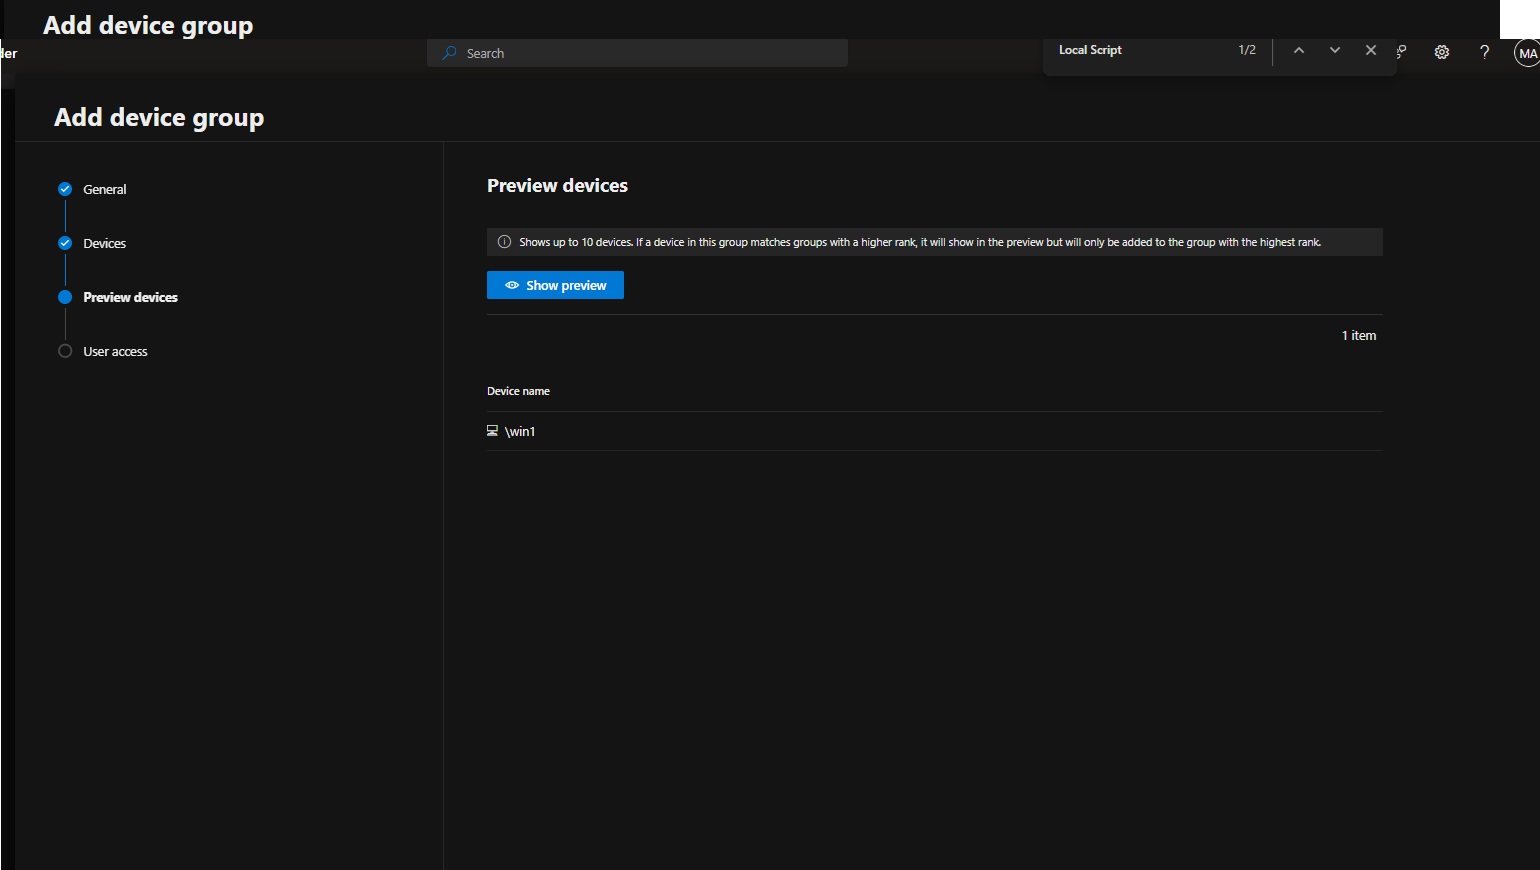
This setting becomes important later in the exercise. Detecting a threat is only one part of endpoint protection; the remediation level determines how much of the response Defender can carry out automatically once malicious activity has been identified.
As a final step, I associated the sg-IT group with the device group so the intended SOC users could access the devices assigned to it.
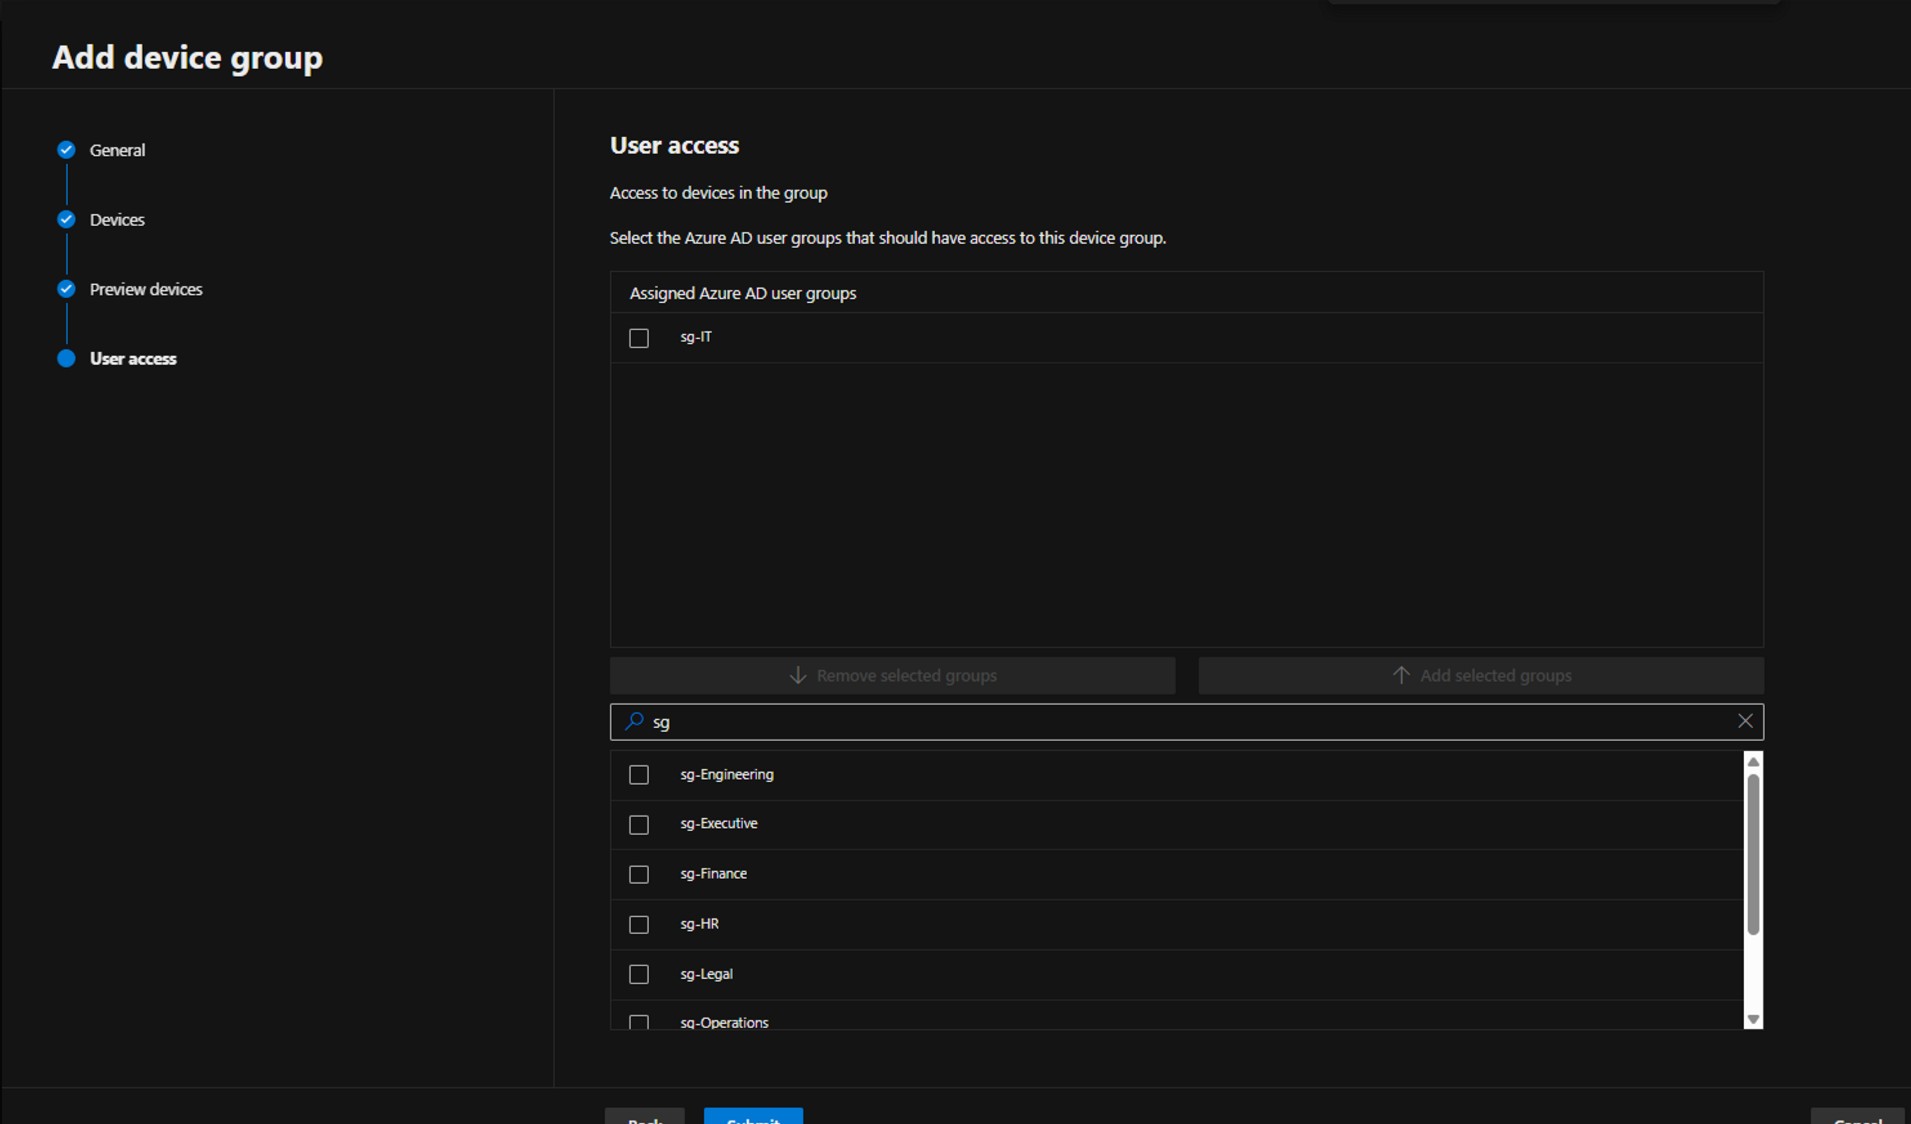
With that in place, the device group configuration was complete: WIN1 was grouped under the required scope, Full remediation was enabled, and the relevant analyst group had access to the device set.
This gave me a clean baseline before moving on to the actual threat detection and response workflow.
Validating the Endpoint with a Detection Test
With the initial Defender for Endpoint configuration in place, I wanted to verify one important thing before moving into investigation and response: is WIN1 actually sending usable endpoint telemetry to Microsoft Defender?
The first confirmation came from Assets -> Devices, where WIN1 appeared in the Defender device inventory.
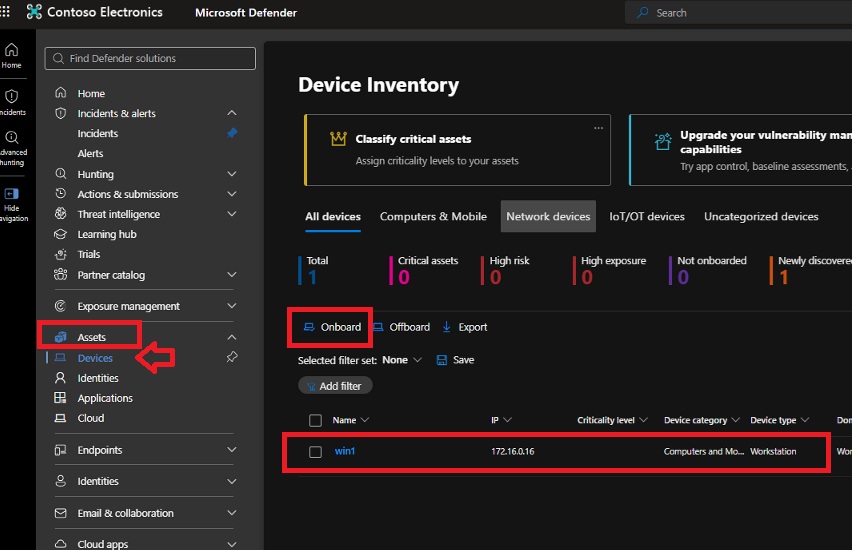
Seeing the device in inventory confirms that the onboarding process has reached the Defender service, but I also wanted to validate the detection pipeline itself.
Back under the endpoint onboarding configuration, the status now showed First device onboarded: Completed, and Defender provided a built-in detection test.
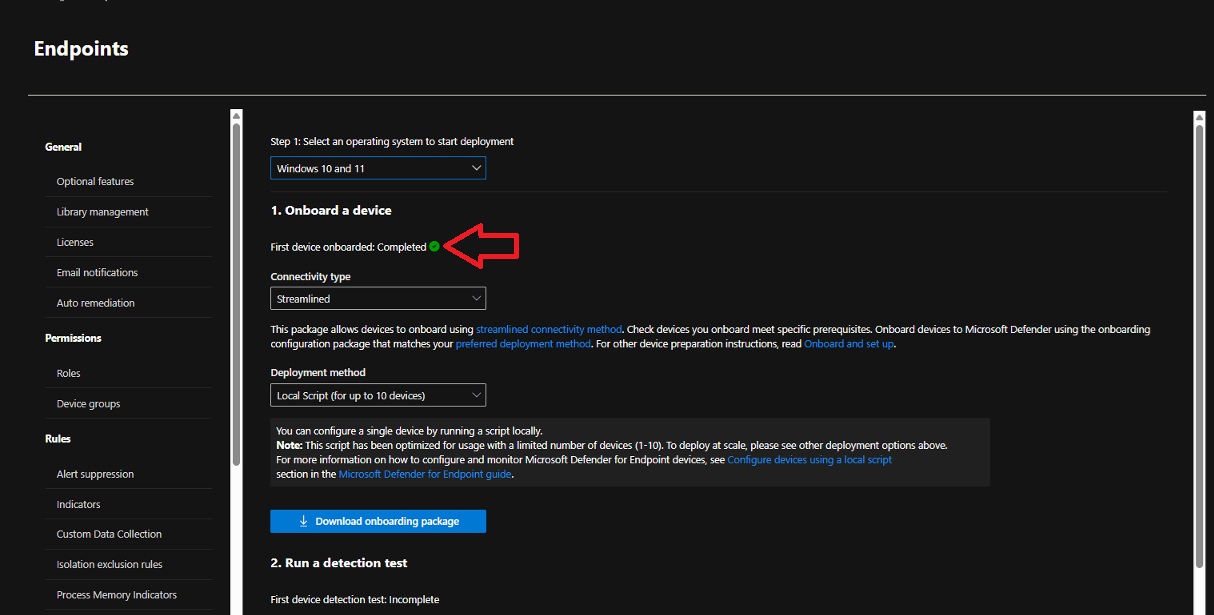
If you compare this with the earlier onboarding phase, Defender initially showed First device onboarded: Incomplete immediately after the onboarding package was prepared. After WIN1 successfully connected and started reporting to the service, the status changed to Completed, confirming that the onboarding process had actually finished from Defender's side, not just that the local script had been executed.
Detection and Investigation
Generating a Controlled EDR Detection
The next step was to validate more than connectivity. I wanted to confirm that endpoint activity could travel through the complete Defender detection pipeline and produce a security signal.
If you scroll down on the endpoint onboarding section, Defender provides a built-in detection test directly on the onboarding page. I copied the provided PowerShell command and executed it from an elevated session on WIN1.
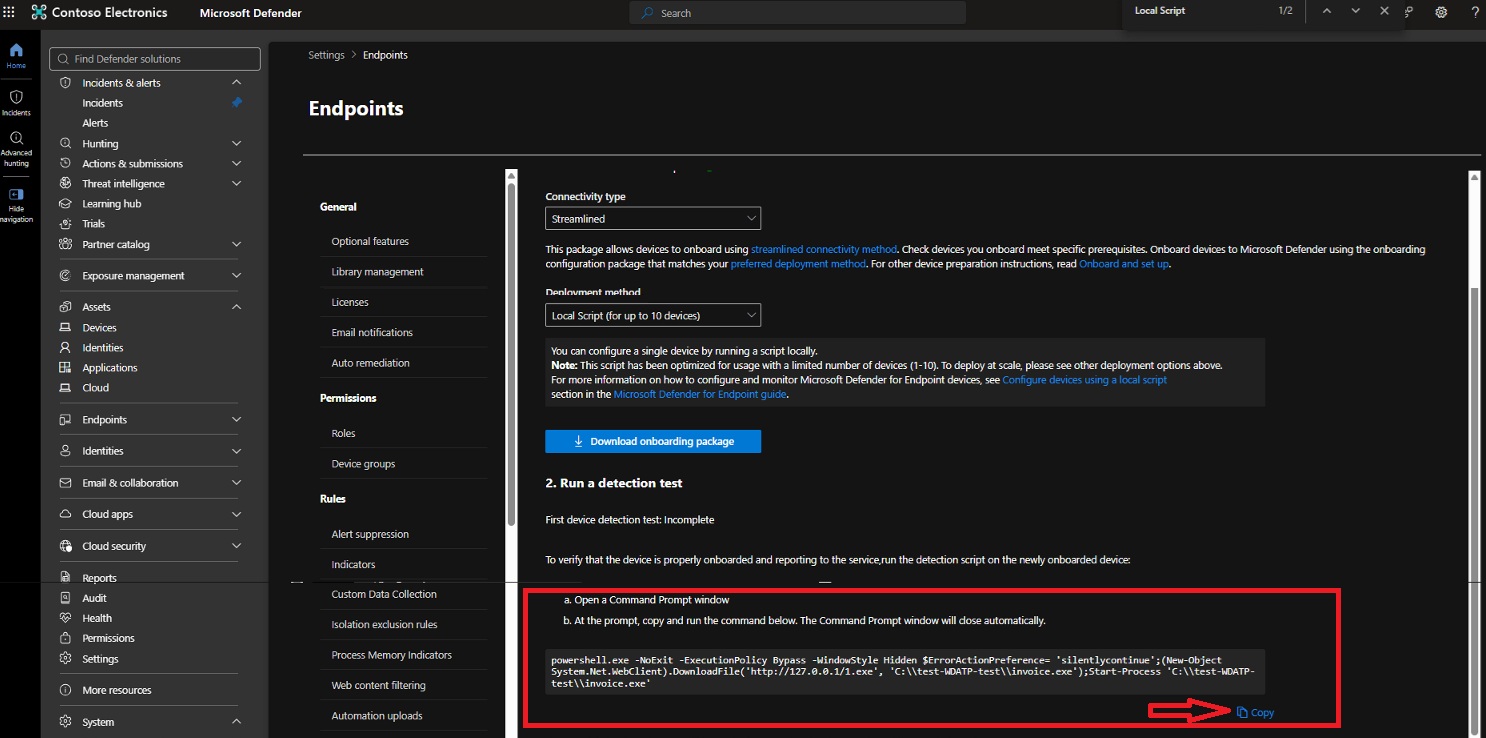
powershell.exe -NoExit -ExecutionPolicy Bypass -WindowStyle Hidden $ErrorActionPreference='silentlycontinue';(New-Object System.Net.WebClient).DownloadFile('http://127.0.0.1/1.exe', 'C:\test-WDATP-test\invoice.exe');Start-Process 'C:\test-WDATP-test\invoice.exe'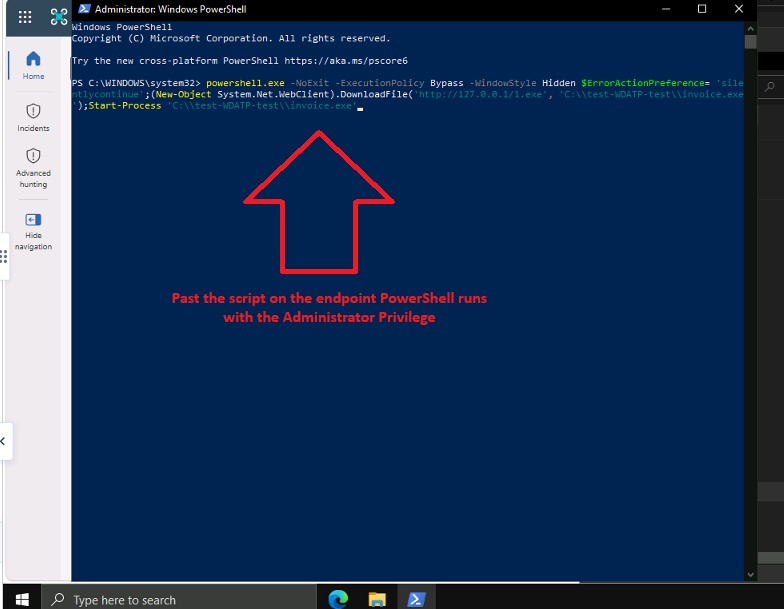
The test intentionally generates controlled suspicious activity, allowing Defender for Endpoint to verify that telemetry from the newly onboarded machine can be received and processed without introducing real malware into the environment.
After the test completed successfully, the onboarding page provided a second confirmation.
Investigating the Alert and Building the Incident Story
Once the detection test had been processed, the interesting part started: looking at the signal from a SOC analyst's point of view.
Under Incidents & alerts -> Alerts, Defender generated alerts for the suspicious PowerShell activity performed on WIN1. The queue already gave some useful context: the affected device and user, severity, execution category, and EDR as the detection source.
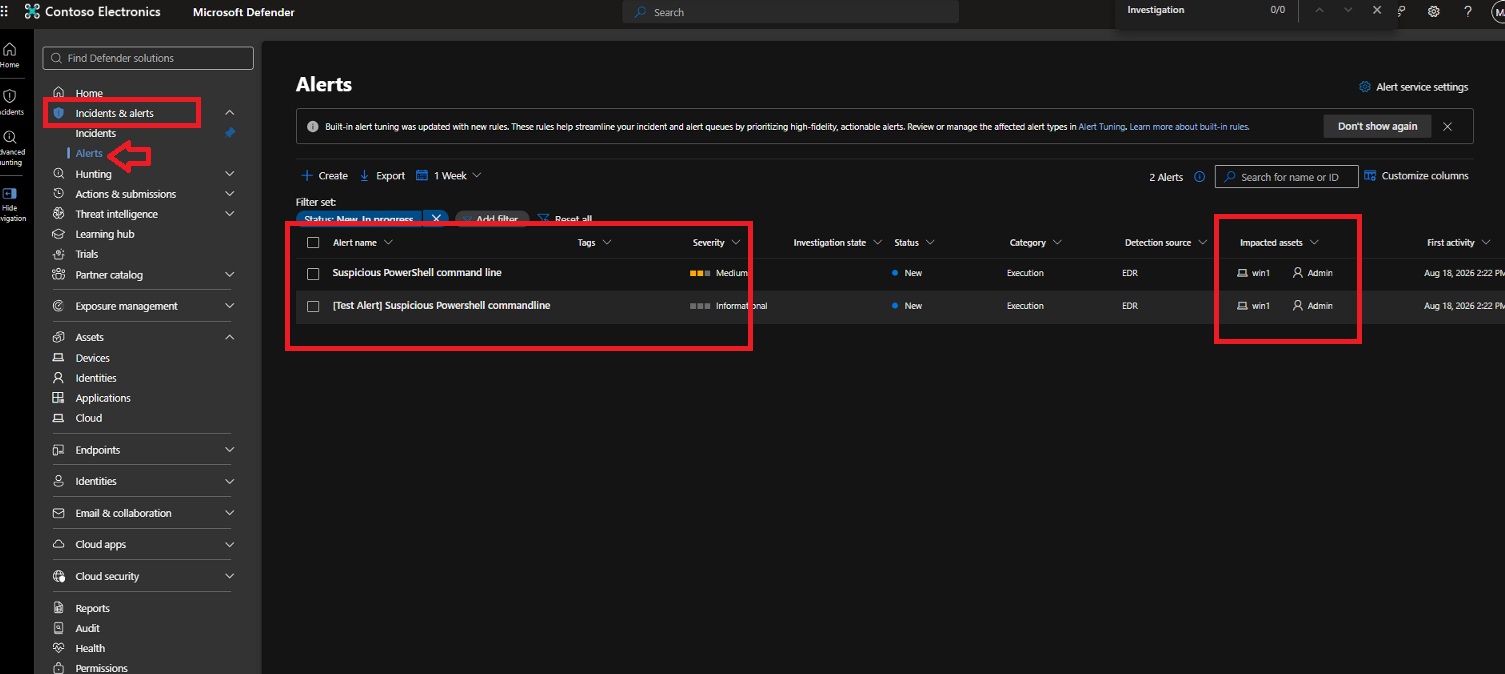
This highlights an important distinction in Microsoft Defender:
- An alert represents an individual suspicious security signal.
- An incident correlates related alerts, entities, and activities into a broader attack story.
Opening the Suspicious PowerShell command line alert showed considerably more than the original detection.
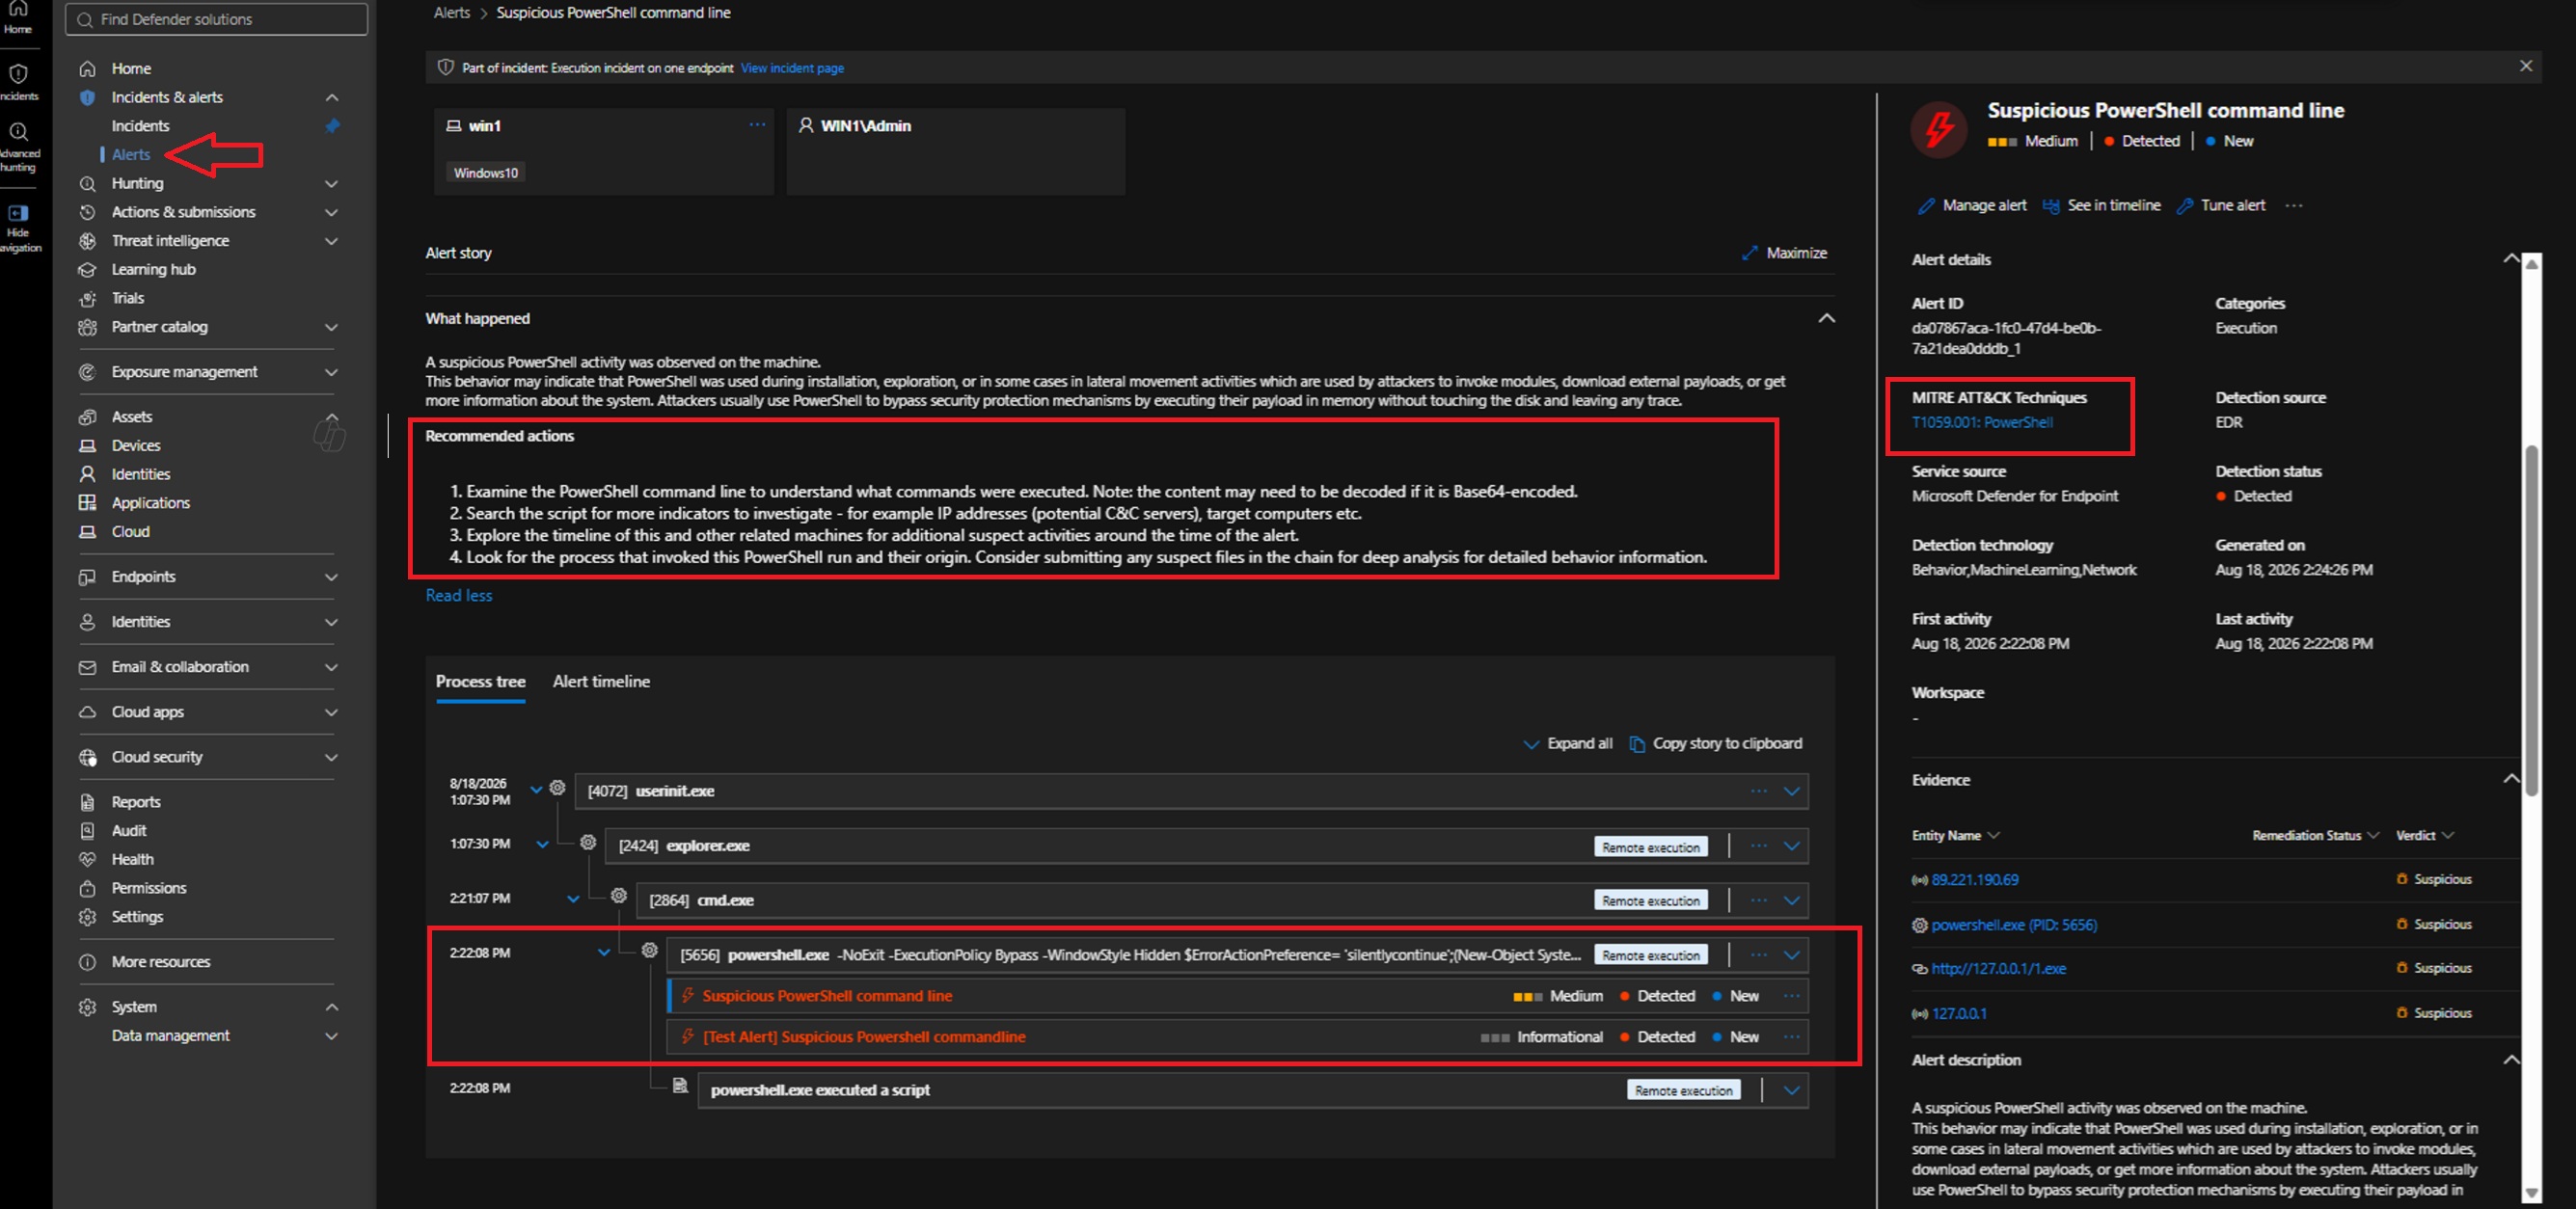
The alert story reconstructed the execution chain around the activity. In this case I could trace the process flow through cmd.exe to powershell.exe and see the suspicious command in its surrounding context.
Defender also mapped the activity to MITRE ATT&CK T1059.001 - PowerShell and surfaced the related evidence and recommended investigation actions.
This is where EDR becomes much more valuable than a simple malware notification. Instead of only telling me that PowerShell was suspicious, Defender provided the process relationships, affected endpoint, user, network indicators, and surrounding events needed to understand how the activity occurred.
From Individual Alerts to an Incident
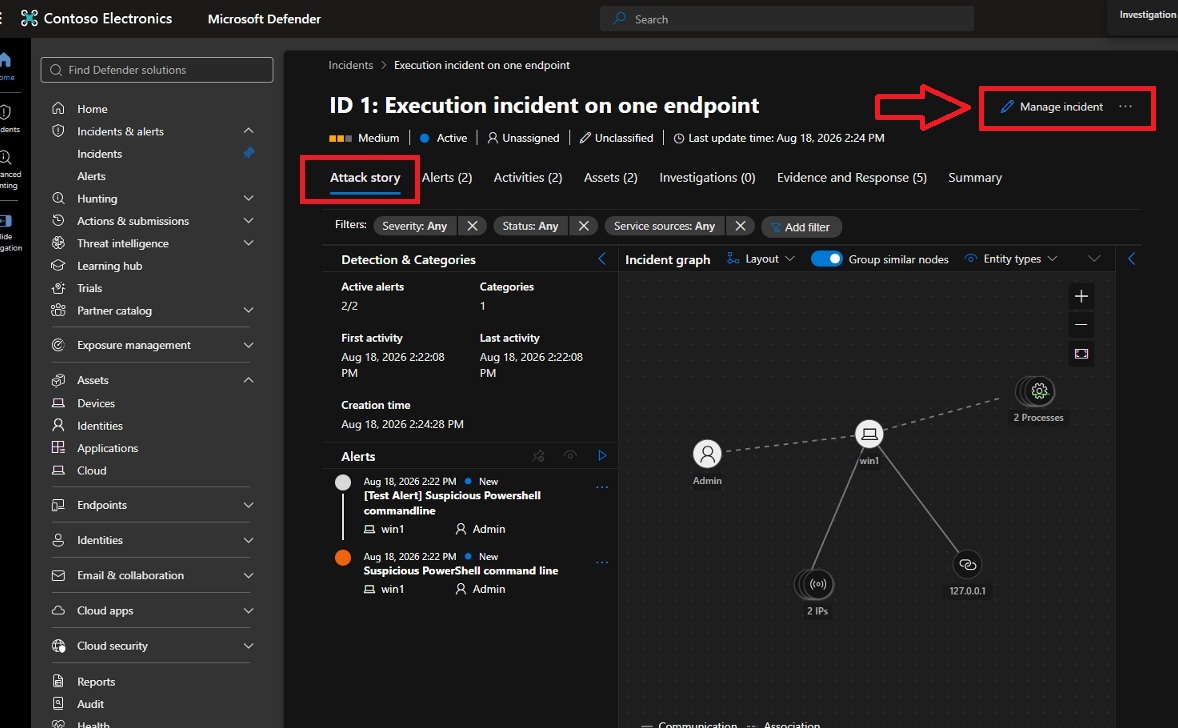
Defender automatically correlated the related PowerShell detections into an incident named Execution incident on one endpoint.
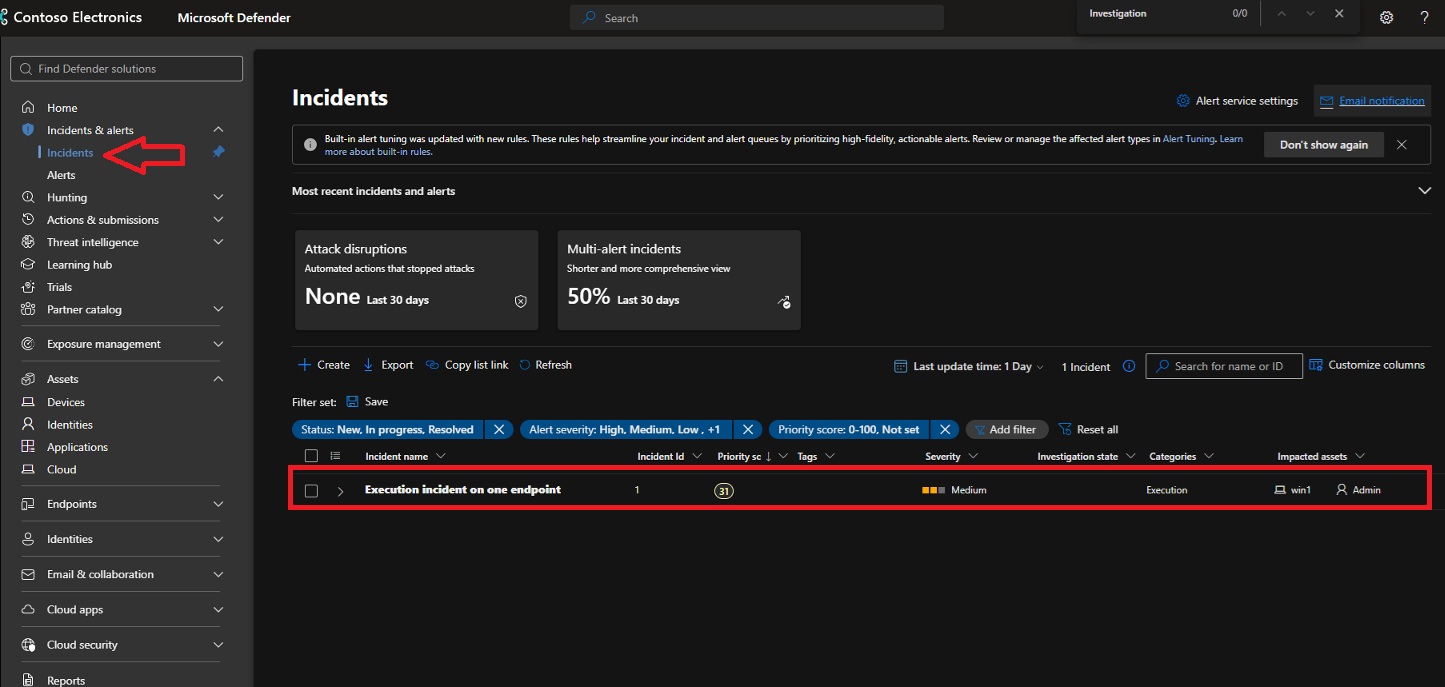
The Attack story provided a much better SOC-level view of the event. Rather than investigating two separate alerts independently, I could see the affected user, WIN1, related processes and IP entities, and both detections represented together in the incident graph.
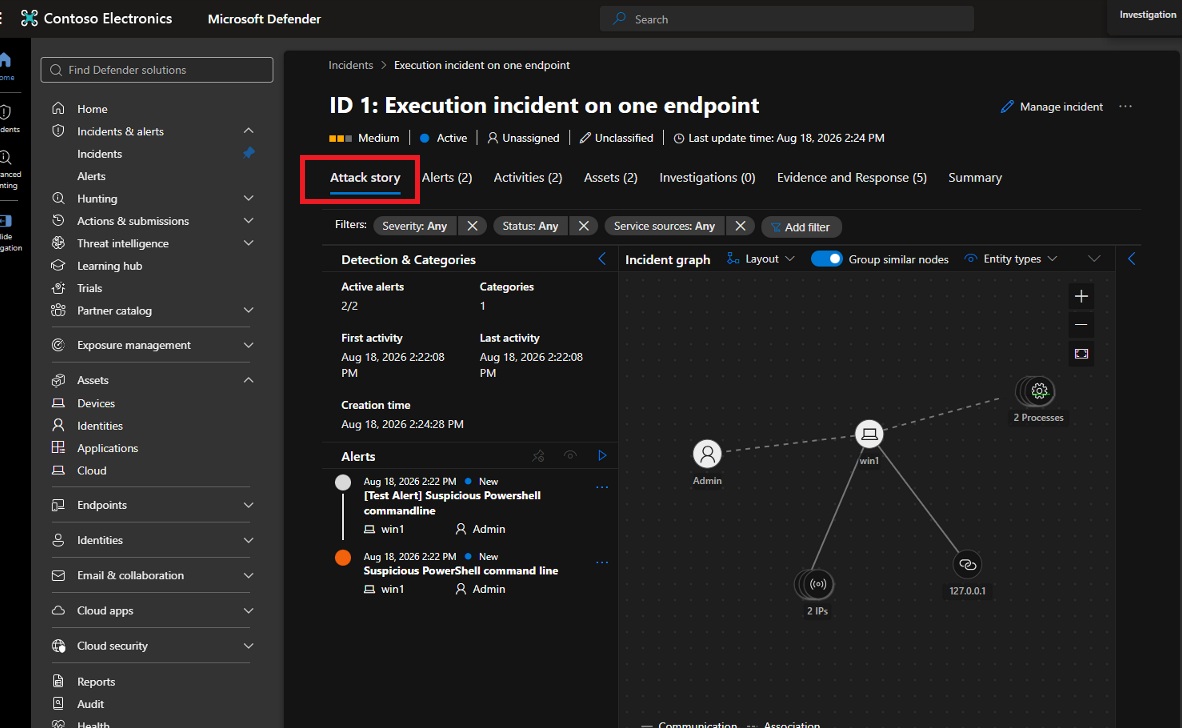
This distinction is useful in real investigations:
- Alerts tell me what Defender detected.
- The incident helps me understand the attack as a whole.
Seeing Defender Correlation Expand the Incident
I later generated the same controlled activity from another onboarded endpoint, WIN2. Instead of treating those detections as a completely unrelated investigation, Defender correlated them with the existing activity.
The incident expanded from Execution incident on one endpoint to Execution incident on multiple endpoints, now containing four related alerts and both WIN1 and WIN2.
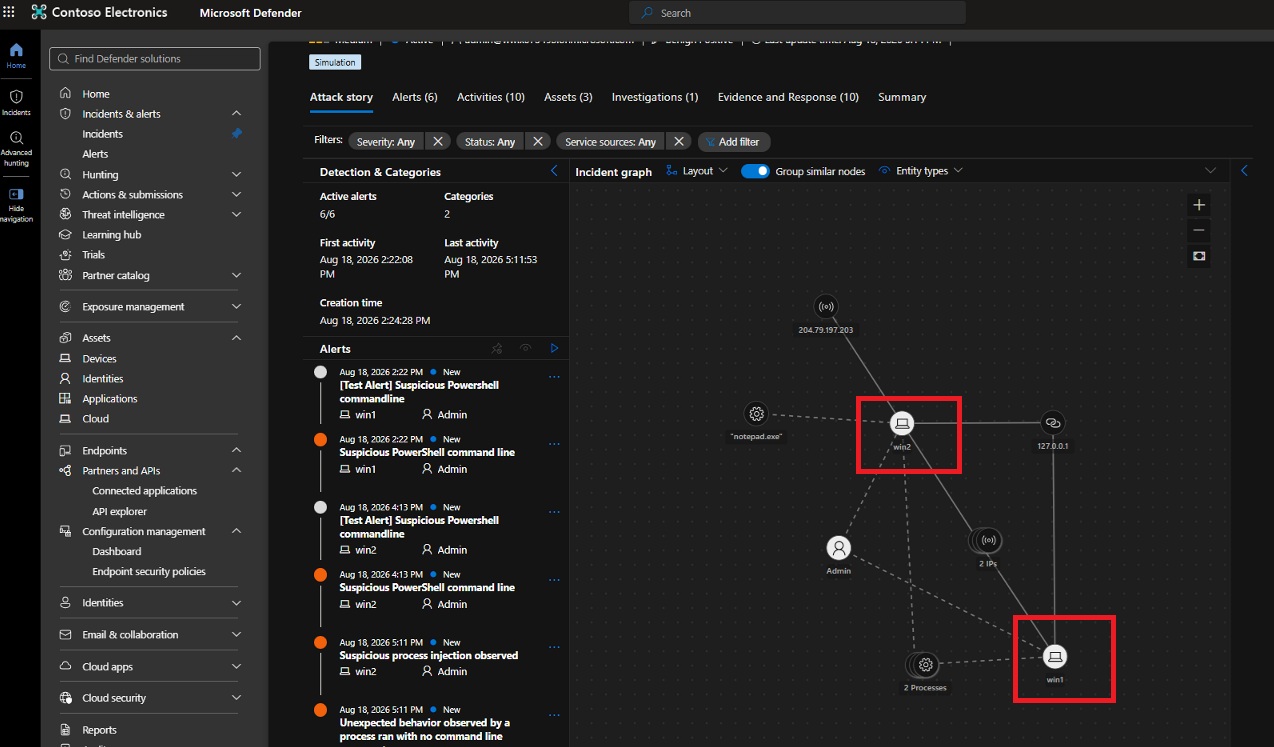
The incident graph also changed accordingly, giving me one consolidated representation of the affected devices, user, processes, and network indicators.
This is an important capability in a real SOC. An attacker frequently performs the same technique across several endpoints, and analyzing each resulting alert independently can hide the larger pattern. Defender XDR correlation is designed to bring related alerts together so the analyst can investigate the broader attack story rather than a collection of isolated notifications.
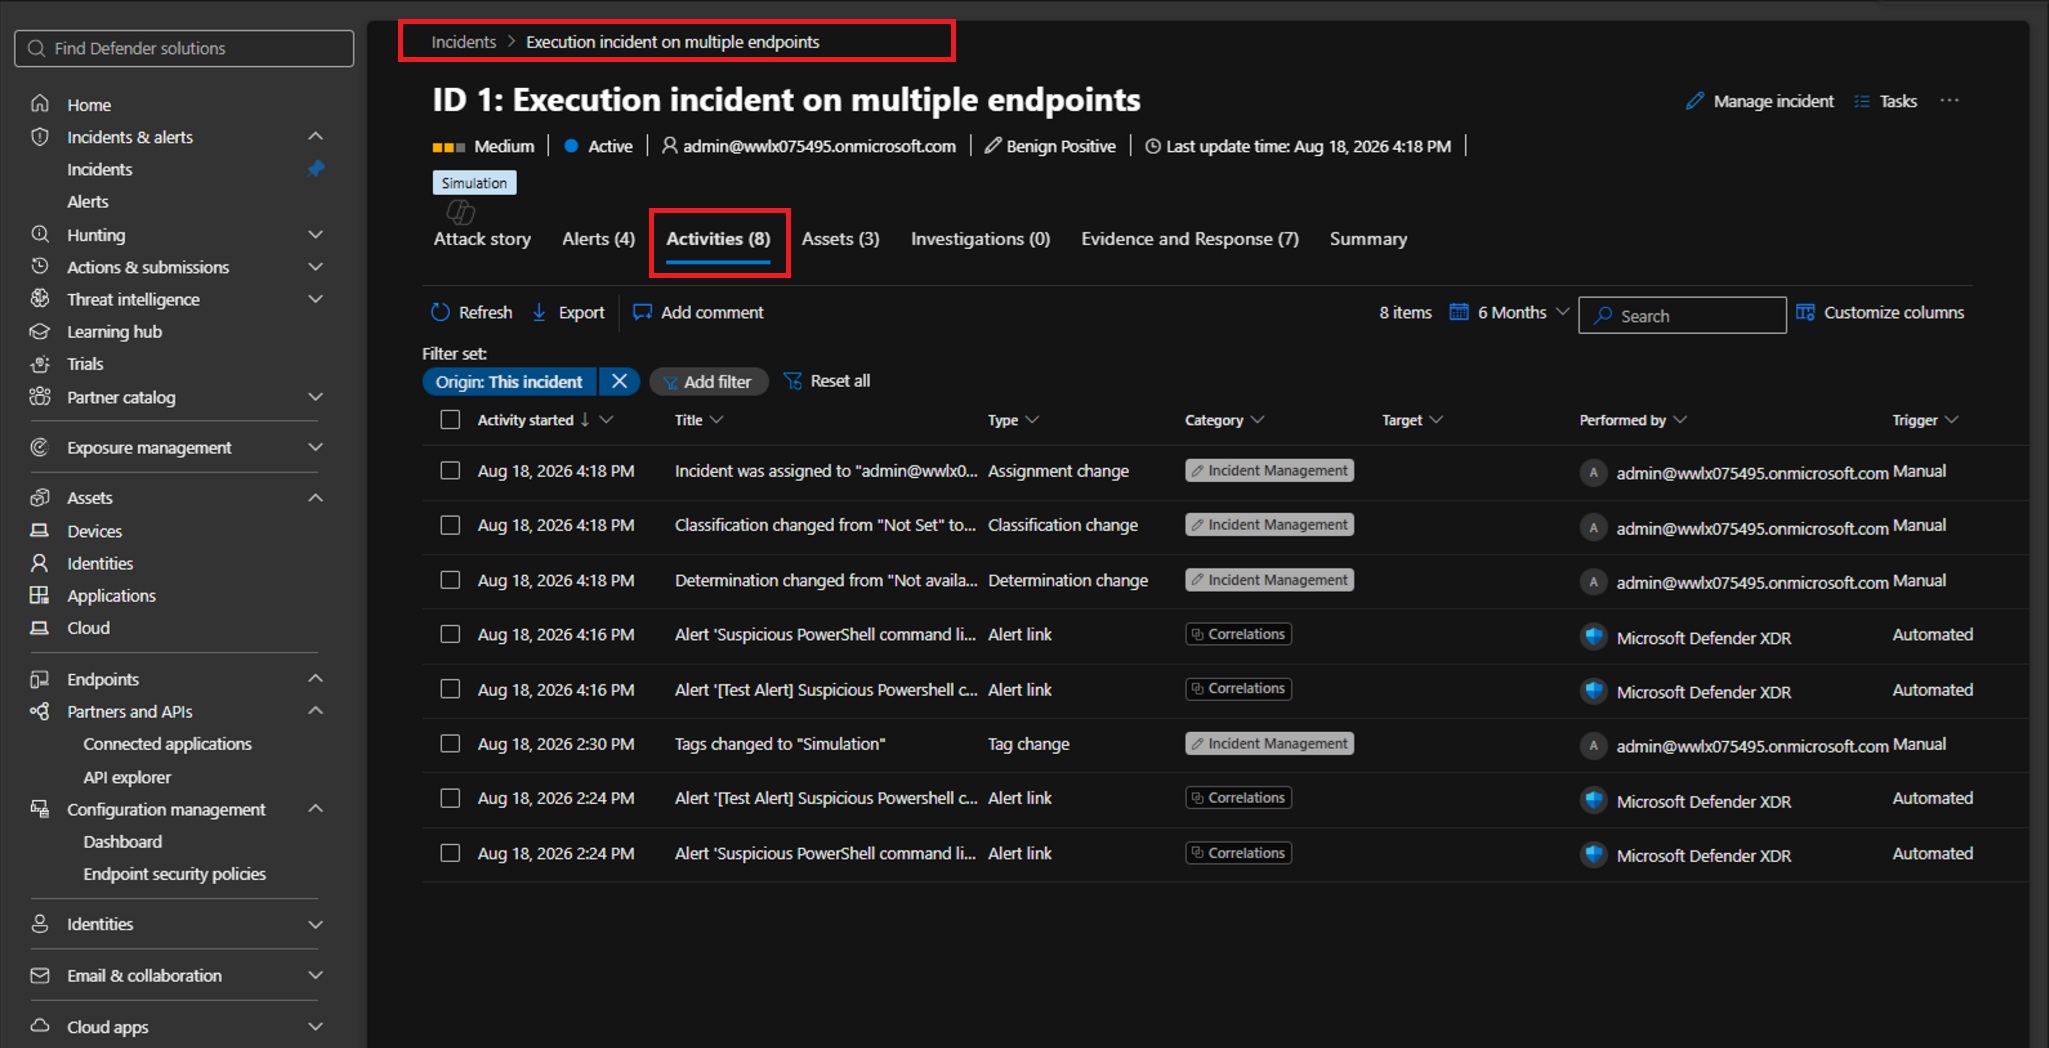
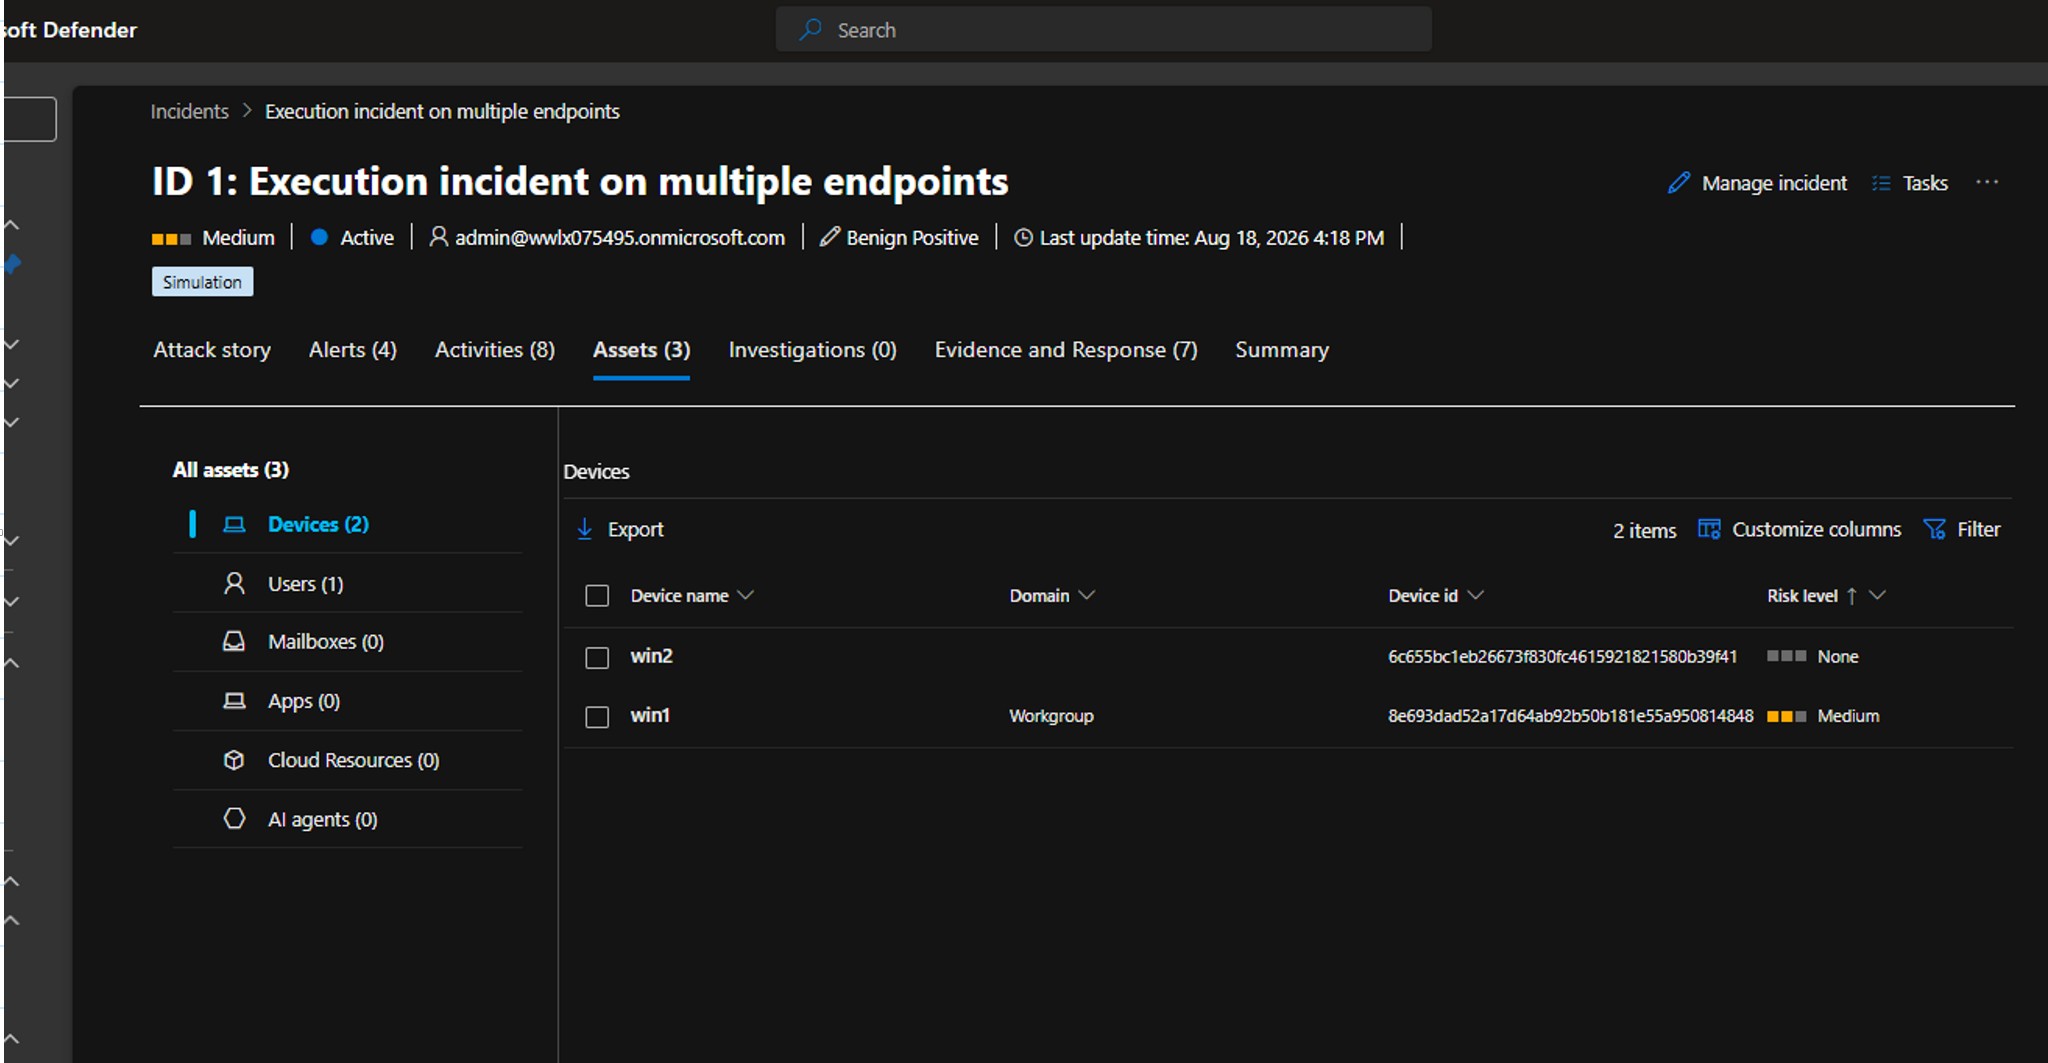
The Activities and Assets tabs provided two additional perspectives: Activities recorded both automated correlations and analyst changes, while Assets showed the devices and users involved in the incident.
Classifying the Known Simulation
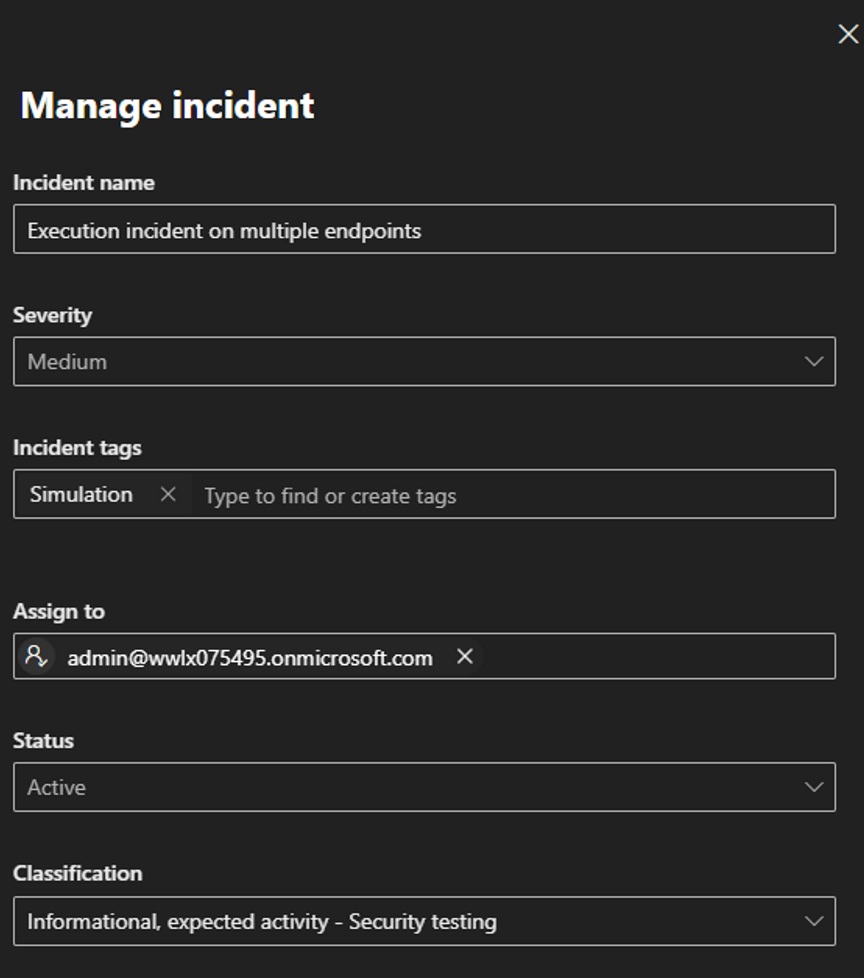
Because I knew exactly where this activity came from, I could complete the triage process accordingly. I assigned the incident, added a Simulation tag, and classified the activity as expected security testing rather than treating it as a genuine compromise.
In a real investigation, this decision should only be made after the evidence has been reviewed. Classification is not simply administrative housekeeping, it records the analyst's conclusion and helps maintain a useful incident queue.
In this case, however, the result was exactly what I wanted to see: a controlled PowerShell test generated endpoint telemetry, Defender converted that telemetry into alerts, and Defender XDR correlated those alerts and affected assets into an investigation-ready incident.
The next question is the operational one: what can we actually do from Defender when the endpoint requires containment or remediation?
Simulating an Attack to Test Defender's Response
Lab safety note: This simulation should only be executed in an isolated test environment. The objective is to deliberately generate suspicious behavior so that Defender's detection and response capabilities can be observed.
The previous detection test was useful for confirming that telemetry could travel from WIN1 to Defender for Endpoint, but it was still only a basic connectivity and detection validation. I wanted to go one step further and generate activity that looked more like something an endpoint analyst might encounter during a real investigation.
For this test, I used this simulation file provided in Microsoft's public security training repository, including recon.txt and AttackScript.ps1.
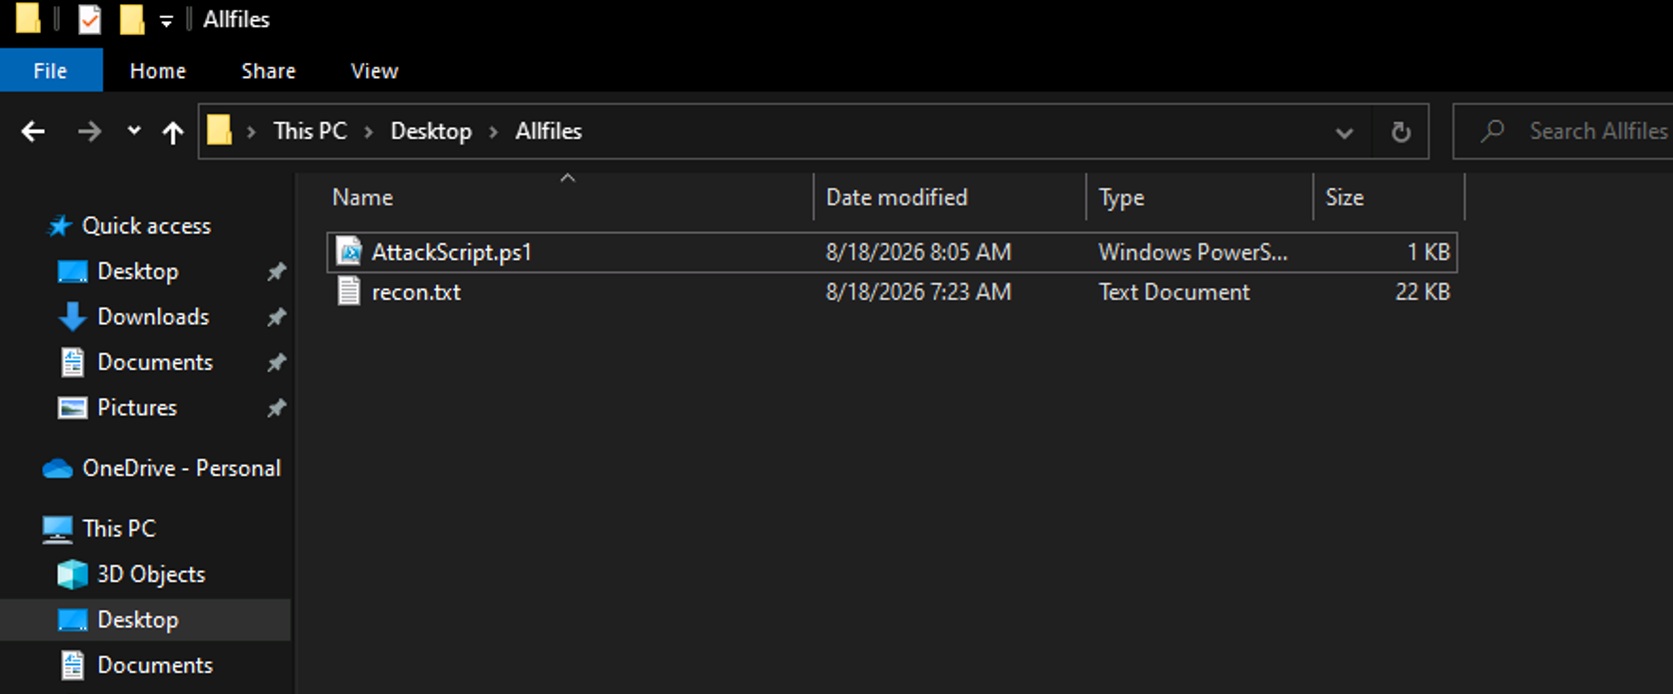
I executed the following script from an elevated PowerShell session on WIN2:
cd C:\Users\Admin\Desktop\Allfiles
          .\AttackScript.ps1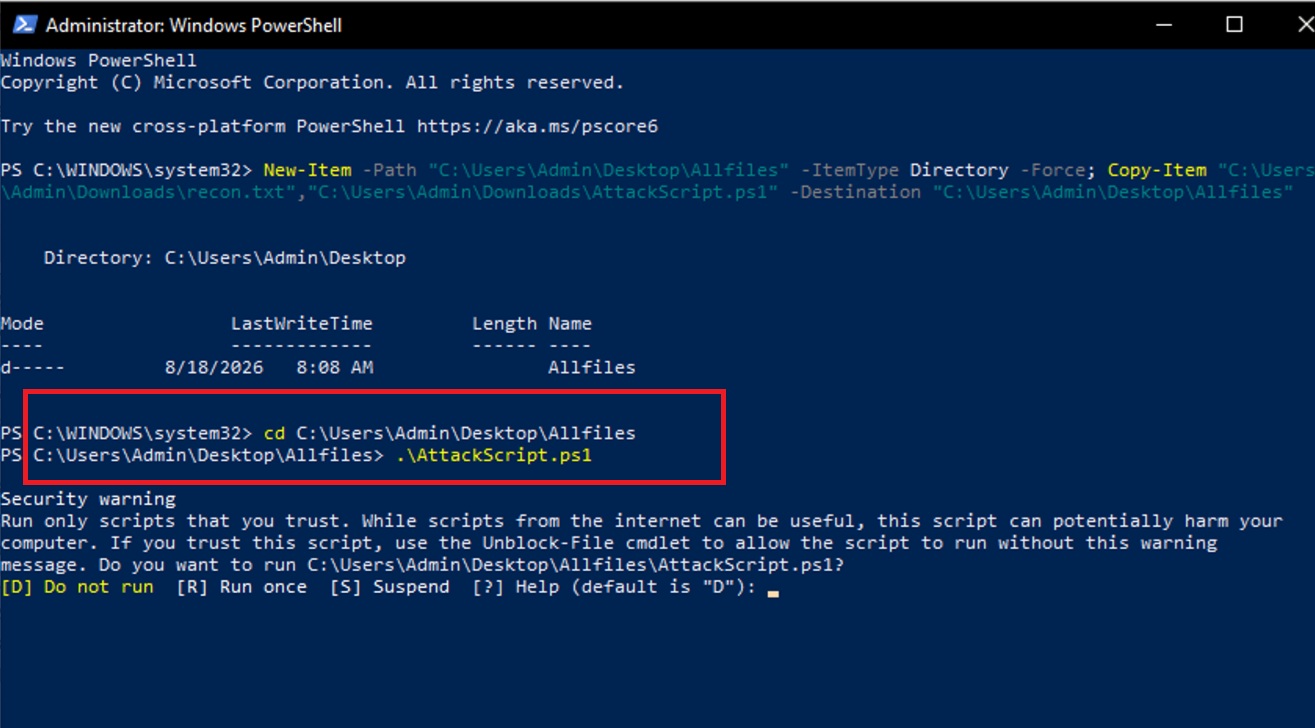
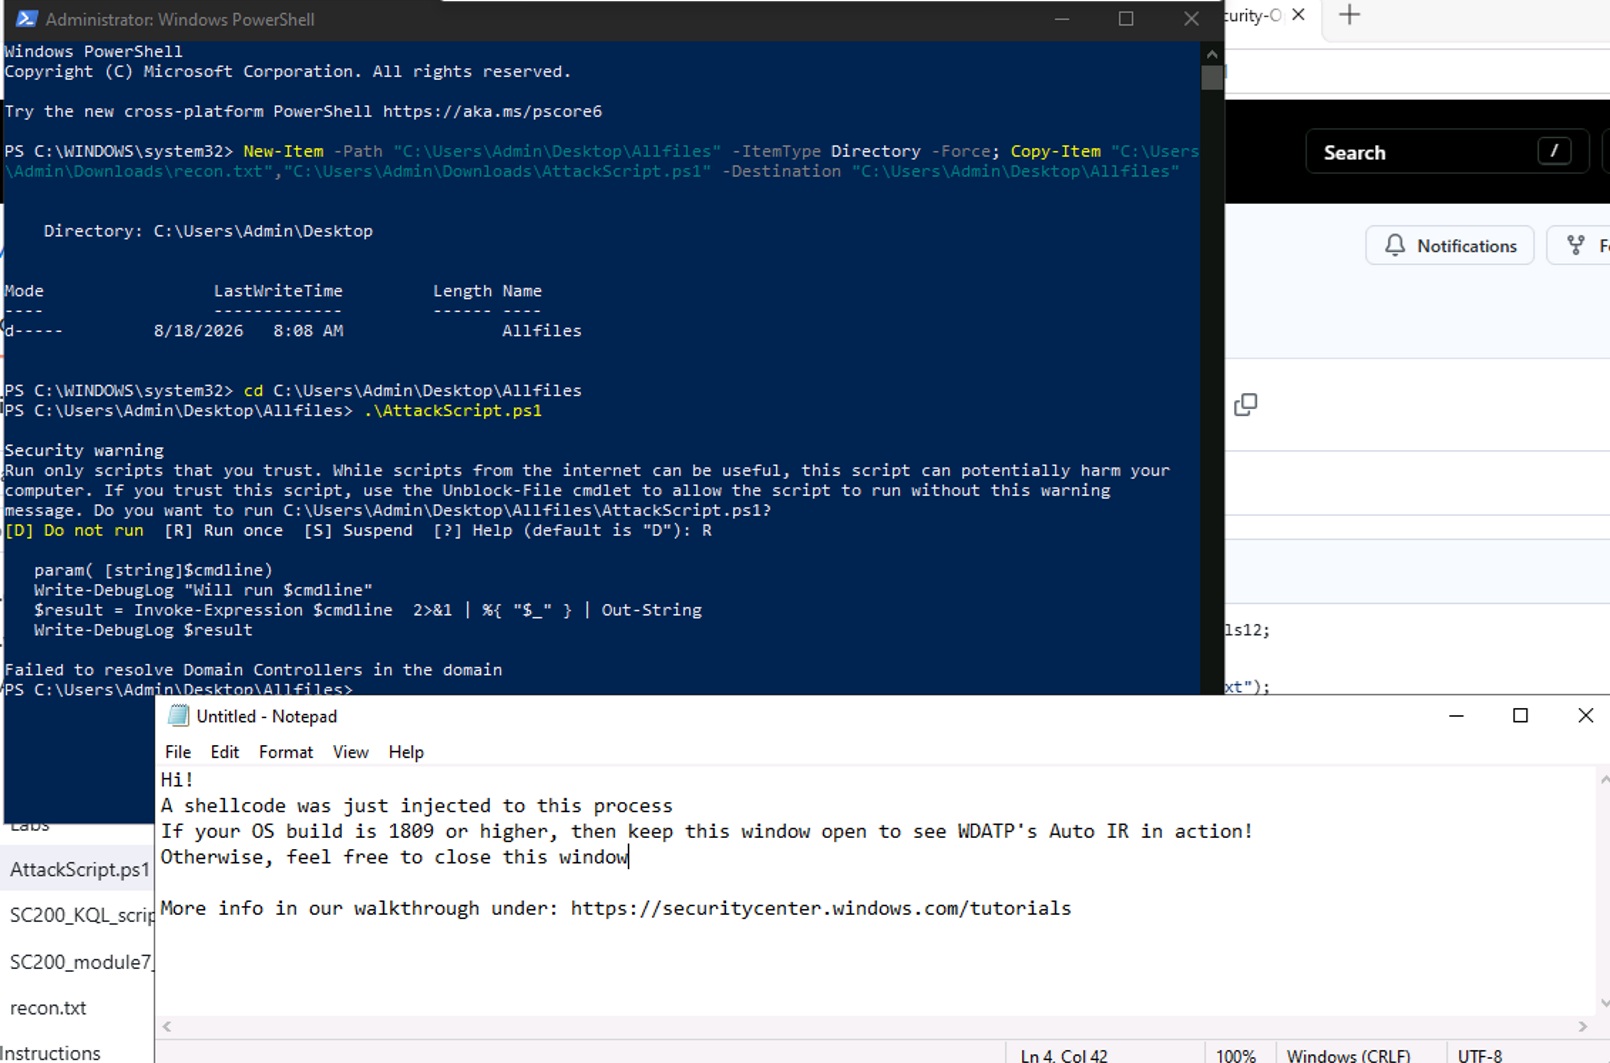
Unlike the earlier onboarding detection test, this simulation generates several behaviors that are more interesting from an EDR perspective. It performs reconnaissance-related activity, injects a test payload into a Notepad process, and produces network behavior intended to resemble communication with external infrastructure.
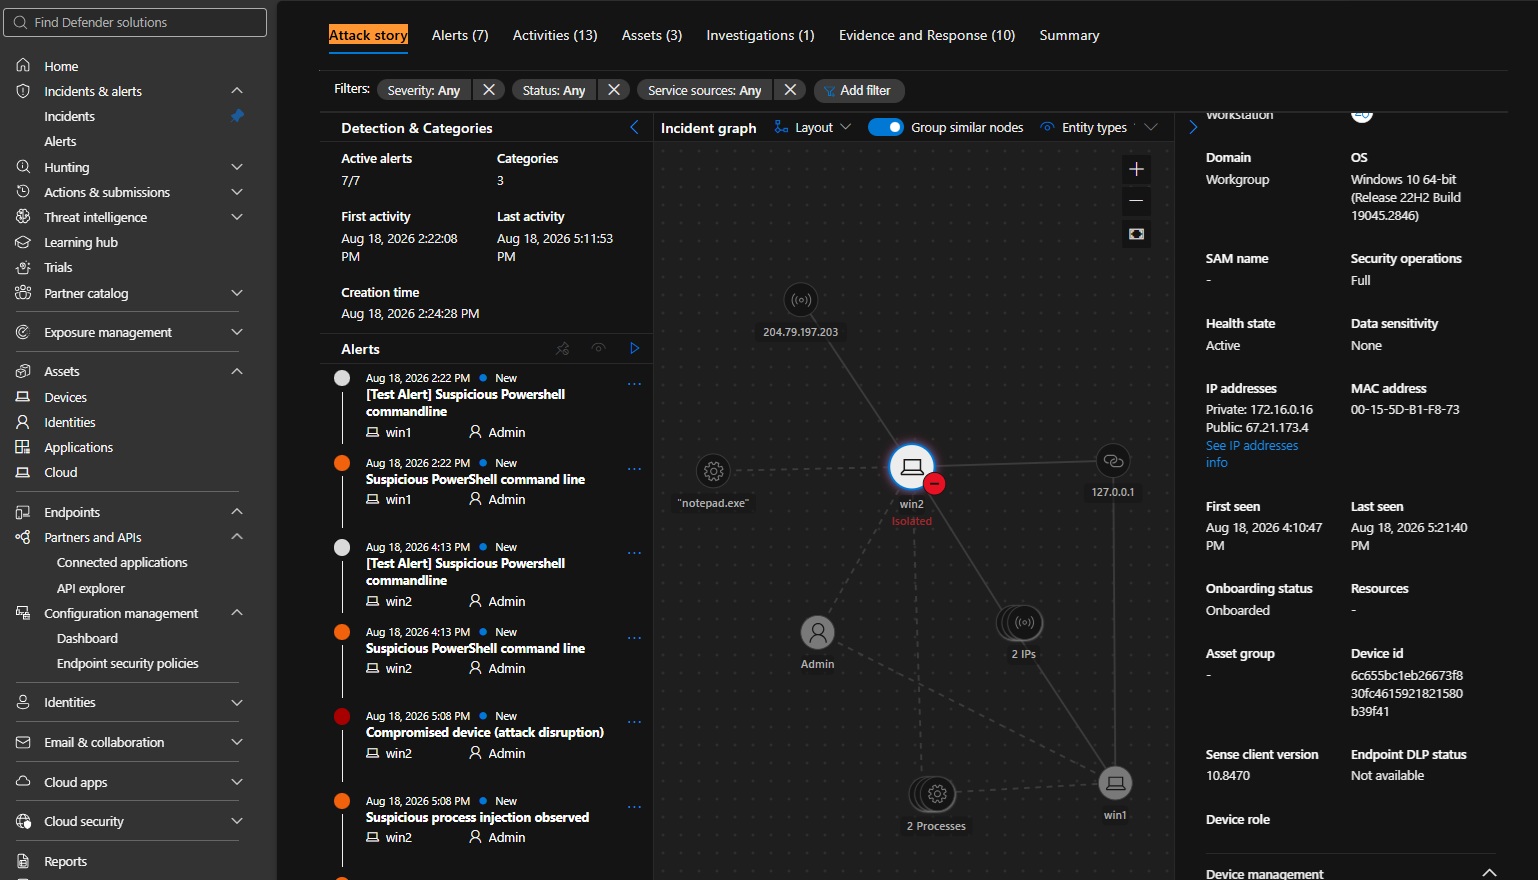
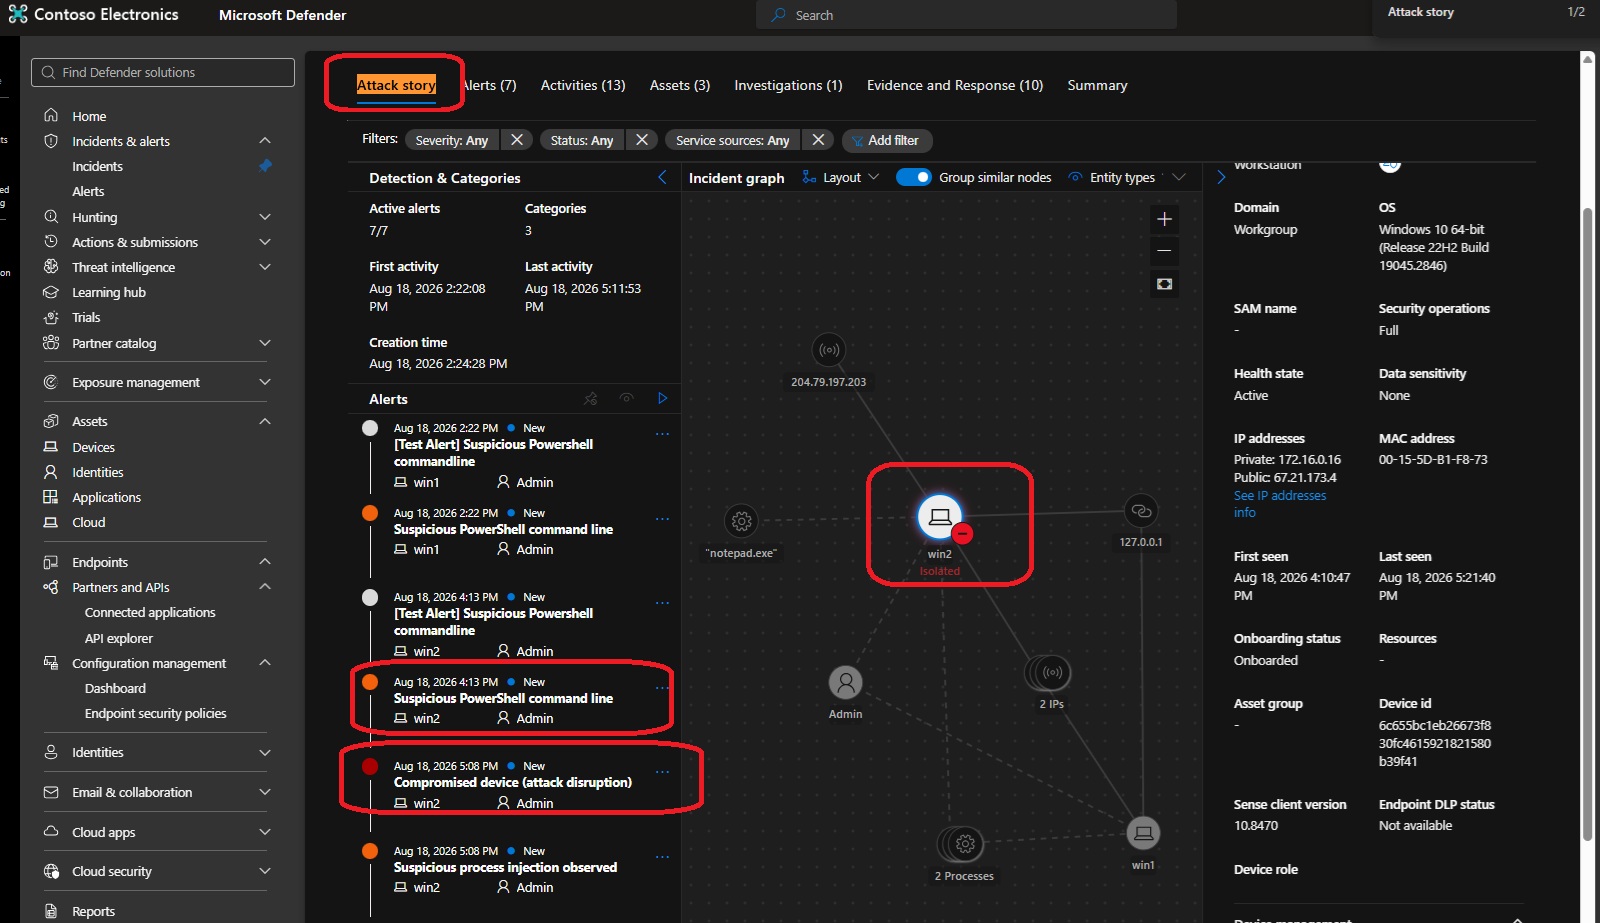
The final incident view brought the whole exercise together. Defender correlated the PowerShell activity, process injection, network indicators, affected endpoints, and user context into a single Attack story. The graph also showed the affected device as Isolated, confirming that Defender had moved beyond detection and into containment.
Conclusion
This hands-on exercise showed how Microsoft Defender for Endpoint can provide much more than endpoint antivirus protection. By onboarding the device, generating controlled suspicious activity, reviewing the resulting alerts, and investigating the correlated incident, I could see how Defender turns raw endpoint telemetry into an actionable security story.
The most valuable part for me was seeing how Microsoft Defender XDR connects different signals and assets together and can automatically take containment actions when suspicious activity reaches a sufficient level of confidence.
For a SOC team, that combination of visibility, investigation context, and automated response can significantly reduce the time between detecting suspicious behavior and containing its potential impact.