
Azure SRE Agent and AKS: Healthy Pods, Broken Connectivity in a NetworkPolicy Outage
Introduction
Your AKS pods are Running and Ready, yet every request fails with HTTP 502. Here is how one NetworkPolicy caused it and how Azure SRE Agent found the cause.
It is one of the most deceptive failure modes in Kubernetes operations, because nothing in the workload view looks wrong.
Restarting pods or rolling back an image does not help, because nothing is wrong with the workload. A running process and a working application are different things. A service can pass its own health check while it cannot reach the dependency it needs to serve a request, and the Kubernetes workload view stays reassuringly green.
We recently engineered and validated an end-to-end approach to this class of incident on Azure Kubernetes Service (AKS). It combines layered connectivity testing, Azure SRE Agent for root-cause analysis, and a least-privilege remediation that is proven by negative tests. To demonstrate it under controlled conditions, we reproduced the outage in a dedicated Azure environment: a frontend proxy calls a backend in another namespace, a single NetworkPolicy breaks the path without any change to application code or images, and Azure SRE Agent is given only the symptom. Applying the fix remains a separate, human-approved decision.
The outcome: both pods stayed Ready with zero restarts while every user request failed with HTTP 502. Azure SRE Agent traced the failure to the policy in about three minutes of read-only checks. A separately approved, additive allow rule restored the path, and two negative tests confirmed it opened nothing else.
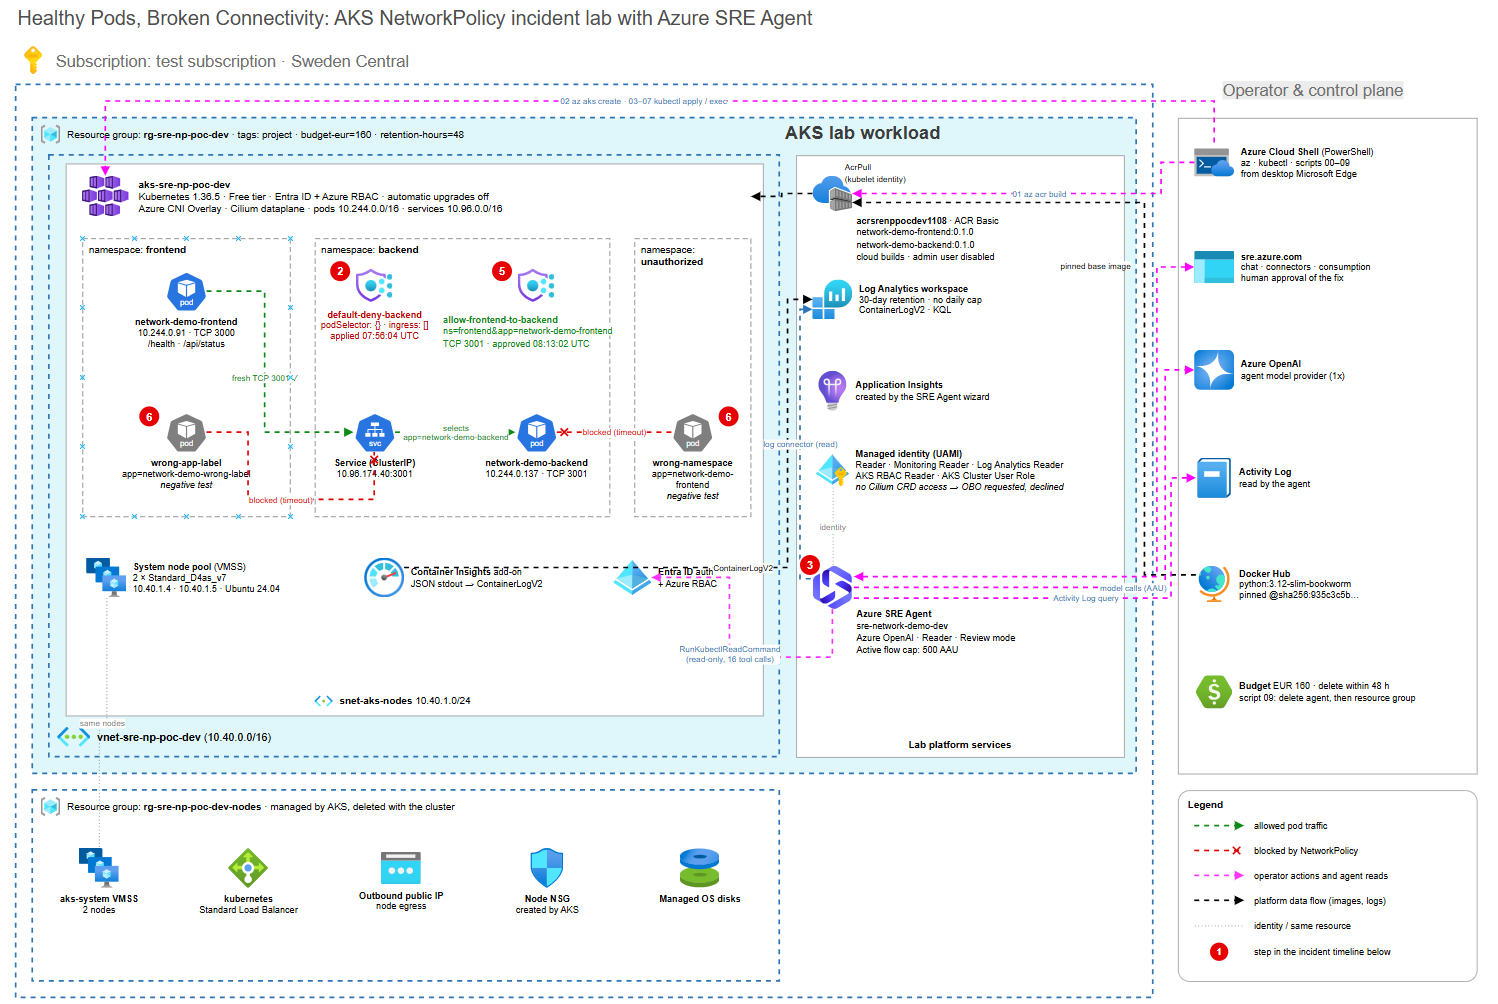
The diagram at the top of this post shows the complete architecture on one page. On the left is the AKS cluster: a frontend pod in one namespace calling a backend in another, with two NetworkPolicies between them. The red one breaks the path; the green one, approved later, restores it. Two grey "impostor" pods try to sneak through after the fix. On the right are the registry, the logs and the SRE Agent, and on the far right the operator tooling: Cloud Shell and the SRE portal.
The red numbers follow the incident as it unfolded. From a healthy baseline to a verified fix took less than twenty minutes:

Notice the gap between steps 2 and 5. For seventeen minutes every request failed, yet nothing in the pod list looked wrong. The rest of this article explains why that happens, how the agent isolated the cause without being told where to look, and how to prove that a fix opens only the path it should.
Every command and script is included, so the complete scenario can be reproduced step by step in your own subscription.
Contents
- Scenario and Architecture
- Environment and Guardrails
- Deploying Azure SRE Agent
- Building the Images and the Cluster
- Deploying the Workloads and Establishing a Baseline
- The Incident: Healthy Pods, Failing Requests
- Giving the Agent Context
- The Investigation
- Approving and Verifying the Fix
- Decommissioning and Key Takeaways
Scenario and Architecture
The application has two roles. The frontend is a proxy service, not a browser interface: it accepts a request on TCP 3000 and forwards it to the backend on TCP 3001. The backend runs in its own namespace so that the policy boundary is easy to see and test.
Each service has its own /health endpoint, and that distinction is central to the scenario. The frontend's health endpoint checks only the frontend, not whether it can reach the backend. Its /api/status endpoint follows the real dependency path and returns a bounded HTTP 502 with the identifier UPSTREAM-CONNECTIVITY-001 when the upstream call fails. That identifier names the failed dependency call, not its root cause.
The cluster runs AKS 1.36.5 with Azure CNI Overlay and the Cilium dataplane. That choice matters: a NetworkPolicy object only describes traffic rules, and the network implementation has to enforce them. We therefore verify the cluster's actual networking configuration instead of assuming that applying YAML proves enforcement.
The approach has three phases: establish a verified baseline, introduce a default-deny ingress policy on the backend, then remediate precisely. Deleting the deny policy would also restore traffic, but it would weaken the security posture instead of fixing the problem. The remediation is an additive allow rule for the frontend namespace and the frontend pod label, to backend TCP 3001. Two negative tests then confirm that a wrongly labelled pod, and a correctly labelled pod in the wrong namespace, are both still blocked.
Environment and Guardrails
The scenario runs in a dedicated, isolated resource group in Sweden Central, so it can be reproduced and removed without touching any other workload: two Linux Standard_D4as_v7 AKS nodes, a Basic container registry, Container Insights and one SRE Agent using Azure OpenAI. The footprint is deliberately small. The method, the checks and the findings apply unchanged to larger platforms.
We applied the same cost discipline we recommend for any short-lived environment: a defined budget (EUR 160), a 48-hour lifetime and tags that record both. Azure enforces neither on its own: a budget is not a hard spending cap, and tags do not schedule deletion. AKS also creates its own node resource group, which belongs in the cost inventory and in the decommissioning step.
Understand How SRE Agent Is Billed
SRE Agent has two billing components: an always-on charge and active usage, measured in Azure agent units (AAUs). Stopping or idling the agent does not remove the always-on charge; only deleting it does. The capture below shows the pricing page with Sweden Central and EUR selected on 5 November 2026. Treat it as an explanation of the billing model, not a current quote, and check the SRE Agent pricing page before you deploy.
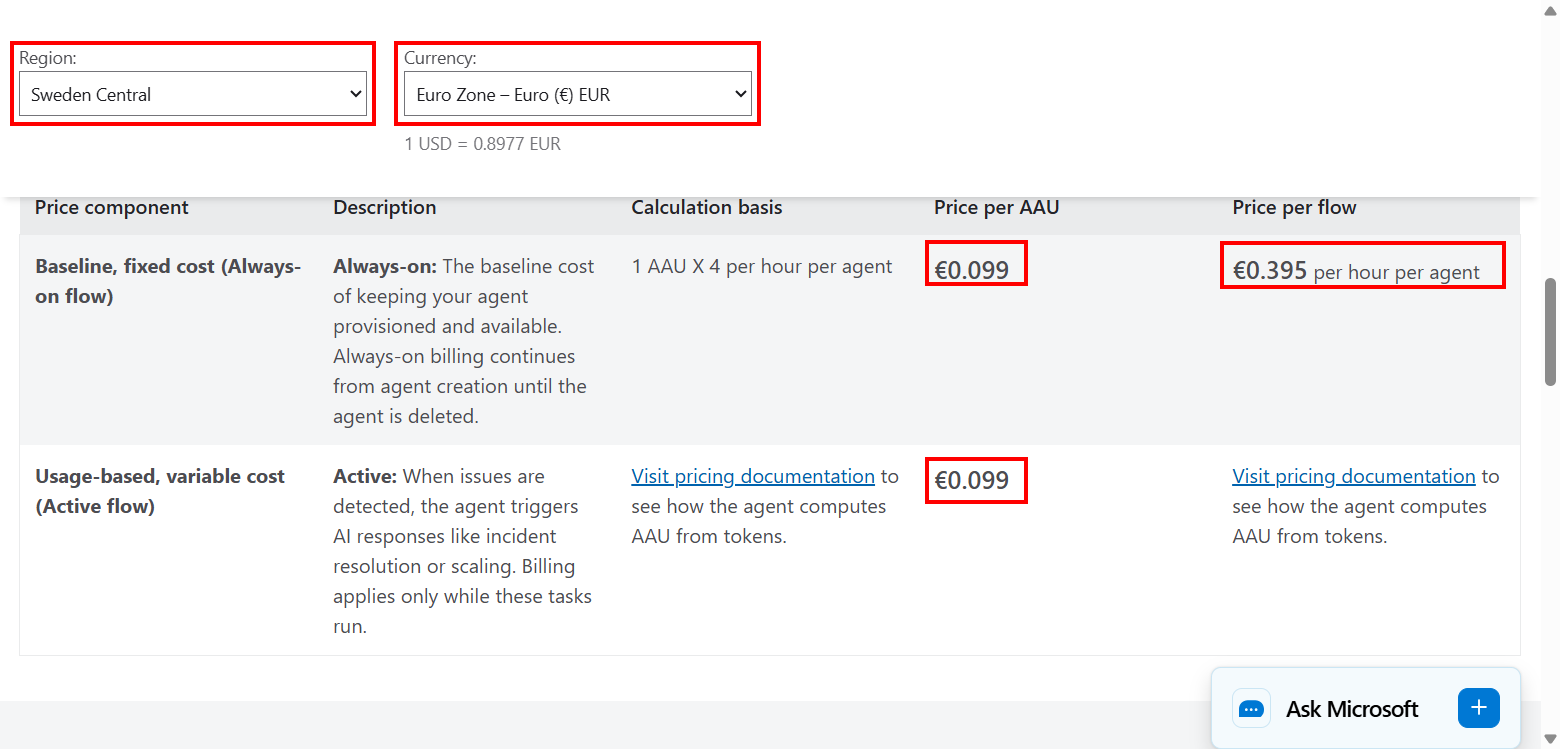
For reference, the rates on 8 November 2026 were EUR 0.1742 per node-hour for Standard_D4as_v7 (about EUR 16.73 for two nodes over 48 hours, before other resources and taxes) and EUR 0.0953 per AAU of SRE Agent active usage in Sweden Central.
The node price came from the public Azure Retail Prices API. This is a read-only lookup for the Linux, non-Spot consumption rate; an empty result or a failed request is not a zero price.
PowerShell commands: look up the node price
$Filter = [uri]::EscapeDataString(
    "armRegionName eq '$Location' and armSkuName eq 'Standard_D4as_v7'")
$Prices = Invoke-RestMethod -Uri (
    "https://prices.azure.com/api/retail/prices?currencyCode='EUR'&" +
    '$filter=' + $Filter)

$Prices.Items |
    Where-Object {
        $_.type -eq 'Consumption' -and
        $_.skuName -notmatch 'Spot|Low Priority' -and
        $_.productName -notmatch 'Windows'
    } |
    Select-Object retailPrice, currencyCode, unitOfMeasure, effectiveStartDate
The retail API returns no rows for SRE Agent, so the per-AAU rate comes from the pricing calculator endpoint instead. That endpoint is not a guaranteed public API; if its schema changes, use the pricing page rather than assuming a missing property means the service is free.
PowerShell commands: look up the SRE Agent per-AAU rate
$SrePrices = Invoke-RestMethod -Uri (
'https://azure.microsoft.com/api/v3/pricing/sre-agent/calculator/' +
'?culture=en-us&discount=mosp¤cy=EUR')
$SrePrices.offers.'sre-agent-active-and-always-on-flow'.prices.
peragentunit.'sweden-central'Set the Working Context
Everything runs from Azure portal > Cloud Shell > PowerShell, in a dedicated resource group, rg-sre-np-poc-dev, tagged with its purpose, budget and lifetime. Cloud Shell can sign in successfully and still select a different subscription from the one you intend, so the first step sets the context and checks it. If the result is not the intended subscription in the Enabled state, stop here: every later command depends on it.
PowerShell commands: select the subscription
$SubscriptionId = Read-Host 'Enter your test subscription ID'
$ResourceGroup = 'rg-sre-np-poc-dev'
$Location = 'swedencentral'

az account set --subscription $SubscriptionId
az account show --query '{name:name,id:id,state:state}' --output json
Check Capacity Before You Need It
The regional and Dasv7-family quotas both reported 10 vCPUs, none in use. Two four-vCPU nodes need eight, so the cluster fits. An upgrade, however, normally adds a temporary surge node, and twelve vCPUs would exceed the quota. A cluster can fit its starting quota without having room for its default upgrade behaviour. This is a common oversight in capacity planning, and it resurfaces when the cluster is created.
PowerShell commands: read the vCPU quotas
$Usage = az vm list-usage --location $Location --output json | ConvertFrom-Json
if ($LASTEXITCODE -ne 0) { throw 'Quota lookup failed' }

$Usage |
    Where-Object { $_.name.value -match '^(cores|standardDasv7Family)$' } |
    Select-Object @{Name='Quota'; Expression={$_.name.value}}, currentValue, limit
We also confirmed that AKS 1.36.5 was available in the region, and that the resource providers the scenario needs were registered: Microsoft.ContainerService, Microsoft.ContainerRegistry, Microsoft.Network, Microsoft.OperationalInsights and Microsoft.Insights. SRE Agent's resource types live under Microsoft.App, which was registered as well.
PowerShell commands: check AKS versions, node-pool upgrade flags and resource providers
az aks get-versions --location $Location --output json
if ($LASTEXITCODE -ne 0) { throw 'AKS version lookup failed' }$PoolHelp = az aks nodepool update --help | Out-String
[pscustomobject]@{
MaxSurgeSupported = $PoolHelp.Contains('--max-surge')
MaxUnavailableSupported = $PoolHelp.Contains('--max-unavailable')
}$Providers = @(
'Microsoft.ContainerService'
'Microsoft.ContainerRegistry'
'Microsoft.Network'
'Microsoft.OperationalInsights'
'Microsoft.Insights'
)
foreach ($Provider in $Providers) {
az provider show --namespace $Provider `
--query '{provider:namespace,state:registrationState}' --output json
if ($LASTEXITCODE -ne 0) { throw "Provider lookup failed: $Provider" }
}Finally, the container base image is pinned by digest rather than by tag, because a tag can point to a different image later. The first lookup records the manifest-list digest and the Linux amd64 image digest; the second reads the image configuration to confirm the Python version rather than inferring it from the 3.12 tag. The public registry token stays in the session and should not be printed or captured in screenshots.
PowerShell commands: pin the base image and confirm the Python version
$BaseTag = Invoke-RestMethod -Uri (
    'https://hub.docker.com/v2/repositories/library/python/tags/3.12-slim-bookworm/')
$BaseImage = @($BaseTag.images | Where-Object {
    $_.architecture -eq 'amd64' -and $_.os -eq 'linux'
})
if ($BaseImage.Count -ne 1) { throw 'Review the base-image platform selection' }
$PythonBase = 'docker.io/library/python:3.12-slim-bookworm@' + $BaseTag.digest

[pscustomobject]@{
    PinnedBase = $PythonBase
    Amd64Digest = $BaseImage[0].digest
    Updated = $BaseTag.last_updated
}$RegistryToken = (Invoke-RestMethod -Uri (
'https://auth.docker.io/token?service=registry.docker.io&' +
'scope=repository:library/python:pull')).token
$Headers = @{
Authorization = 'Bearer ' + $RegistryToken
Accept = 'application/vnd.oci.image.manifest.v1+json, application/vnd.docker.distribution.manifest.v2+json'
}
$Manifest = Invoke-RestMethod -Headers $Headers -Uri (
'https://registry-1.docker.io/v2/library/python/manifests/' + $BaseImage[0].digest)
$ImageConfig = Invoke-RestMethod -Headers $Headers -Uri (
'https://registry-1.docker.io/v2/library/python/blobs/' + $Manifest.config.digest)
$ImageConfig.config.Env | Where-Object { $_ -match '^PYTHON_VERSION=' }The manifest list resolved to sha256:935c3c5b12357a7e10caa9c1e6ca5692344d97cf229832ef584be2cec9fc03df, and the image reported Python 3.12.16.
Optionally, before anything is deployed, the application's 24 unit and manifest tests can be run on a Windows workstation in an isolated Python environment. This step does not run in Cloud Shell, and all 24 tests pass. That validates the source code. It says nothing about policy enforcement in a live cluster, which is exactly the gap this scenario addresses.
PowerShell commands: run the local source tests (optional, on a Windows workstation)
$SourceRoot = (Resolve-Path './poc-source').Path
$Python = Join-Path $env:LOCALAPPDATA 'aks-sre-networkpolicy-poc/venv/Scripts/python.exe'
$env:PYTHONDONTWRITEBYTECODE = '1'

& $Python -m pytest `
    (Join-Path $SourceRoot 'network-demo-frontend/tests') `
    (Join-Path $SourceRoot 'network-demo-backend/tests') `
    (Join-Path $SourceRoot 'tests') `
    -q -p no:cacheprovider --import-mode=importlib
if ($LASTEXITCODE -ne 0) { throw 'Source tests failed' }
Deploying Azure SRE Agent
Creation, Setup and Investigation Are Different Stages
Three stages are easy to mistake for one another:
| Stage | What it establishes | This run |
|---|---|---|
| Create the agent | Azure provisions the agent, identities and selected monitoring dependencies | Completed; portal reported Succeeded |
| Configure investigation context | Connect the intended logs and resources, and verify that the agent can retrieve evidence | Completed: one Log Analytics connector and one resource group at Reader level |
| Investigate an incident | Provide an actual symptom and inspect the agent's evidence, tool results and reasoning | Completed: root cause identified, fix proposed, separately approved and verified |
An agent resource is not an application-monitoring configuration, and the Application Insights resource created with it does not mean the application's logs are connected. In this scenario the investigation is started manually once the failure is reproduced. No automatic incident trigger is configured, so the focus here is root-cause analysis rather than autonomous detection.
Use the Current Management Experience
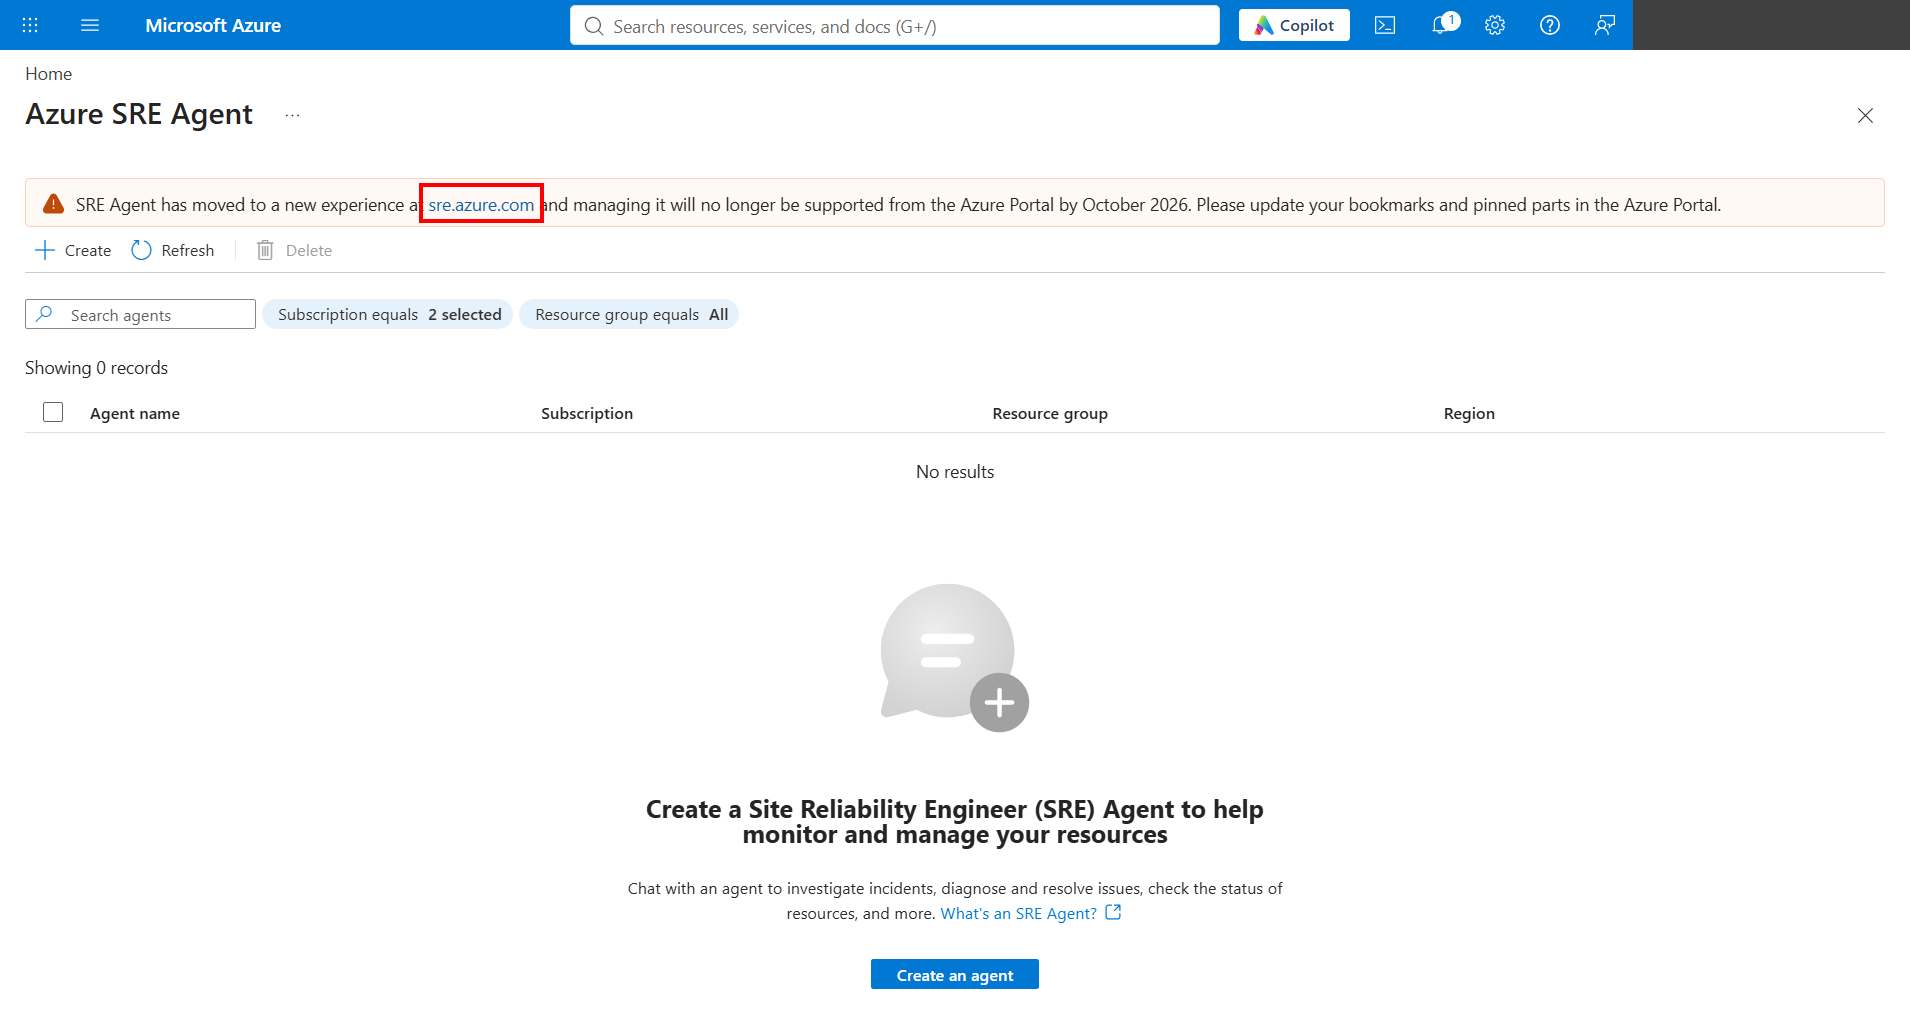
When we opened Azure portal > Azure SRE Agent on 8 November 2026, the portal showed a migration notice pointing to sre.azure.com, while older Create controls were still visible. That makes it easy to follow an outdated walkthrough, so we followed the link to the current experience.
Choose the Deployment Location Deliberately
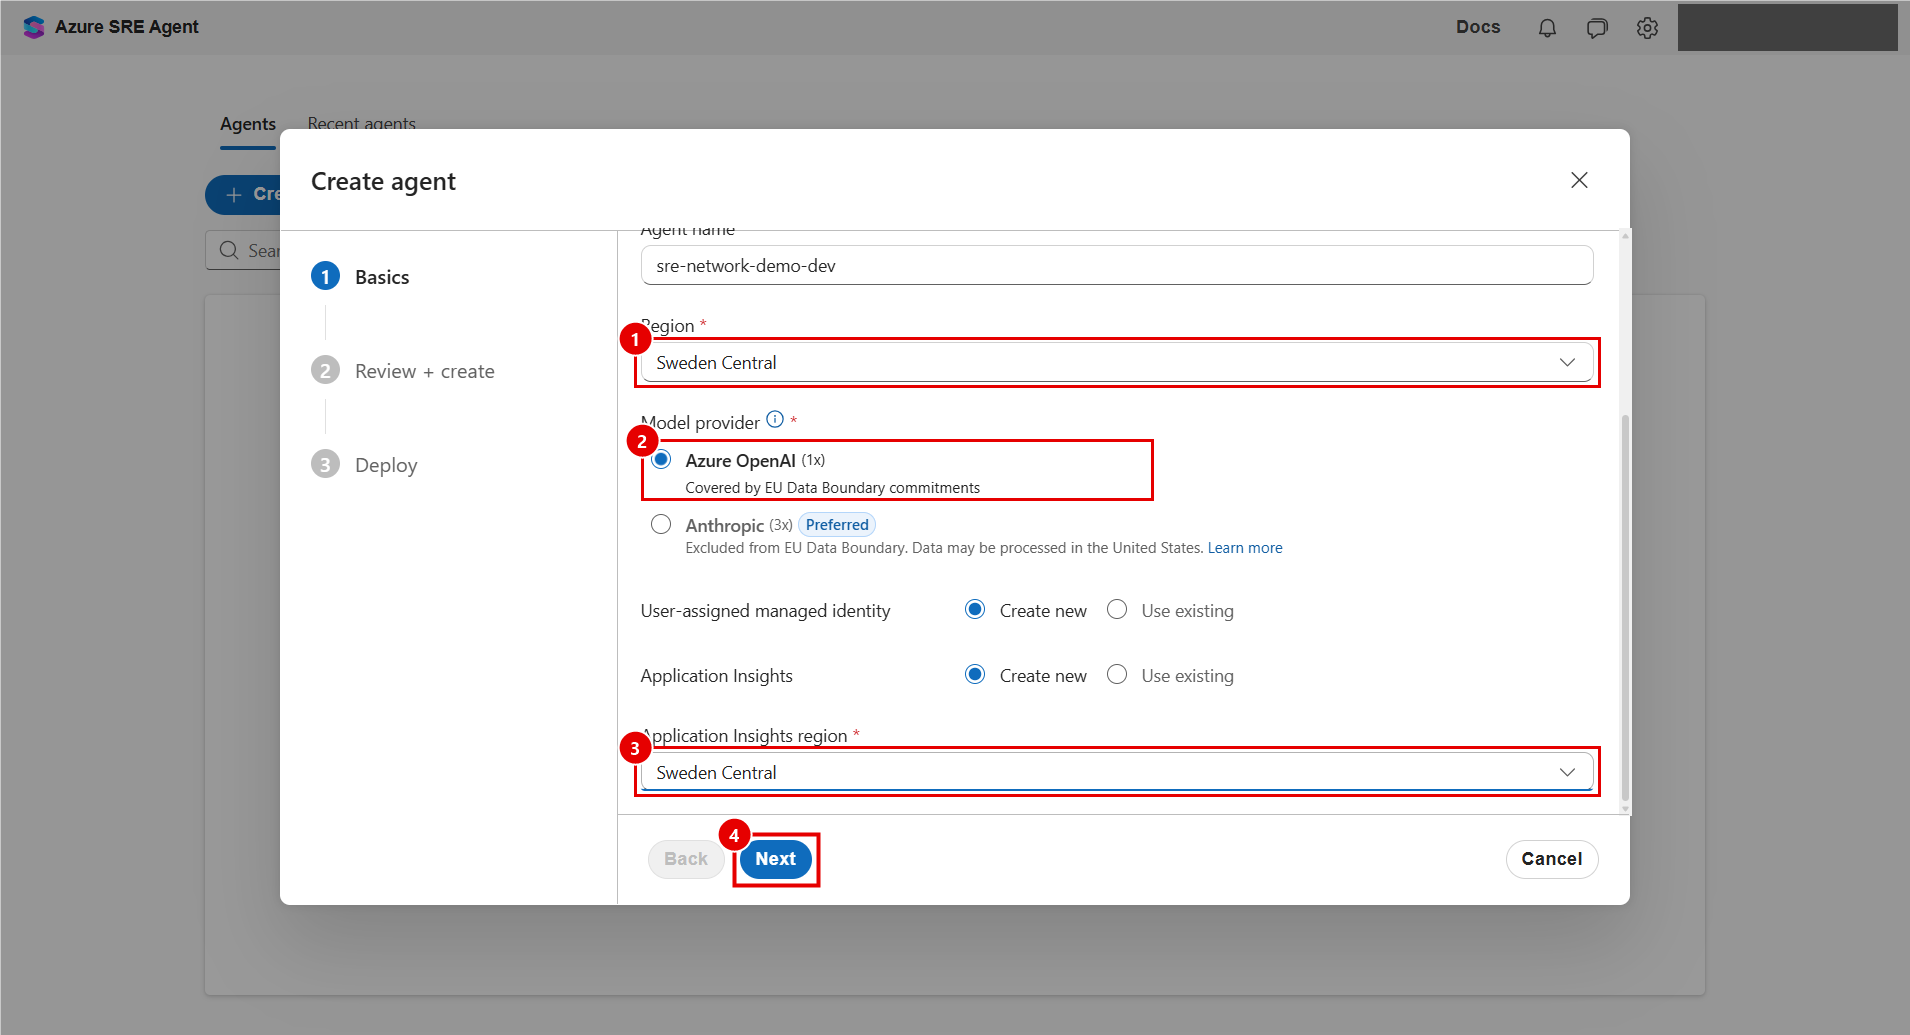
Under sre.azure.com > Agents > Create agent > Basics, we selected the subscription, the resource group rg-sre-np-poc-dev and the name sre-network-demo-dev. One detail deserves attention: changing the subscription makes the form select NetworkWatcherRG automatically, and it has to be replaced with the intended group. A valid default is not necessarily the right one. If the subscription list is empty, the portal is usually signed in to a different directory: switch to the tenant that owns the subscription from the account menu in the top-right corner.
The resource group chosen here only decides where the agent is created. It does not decide what the agent may investigate; that is a separate boundary, which is configured later.
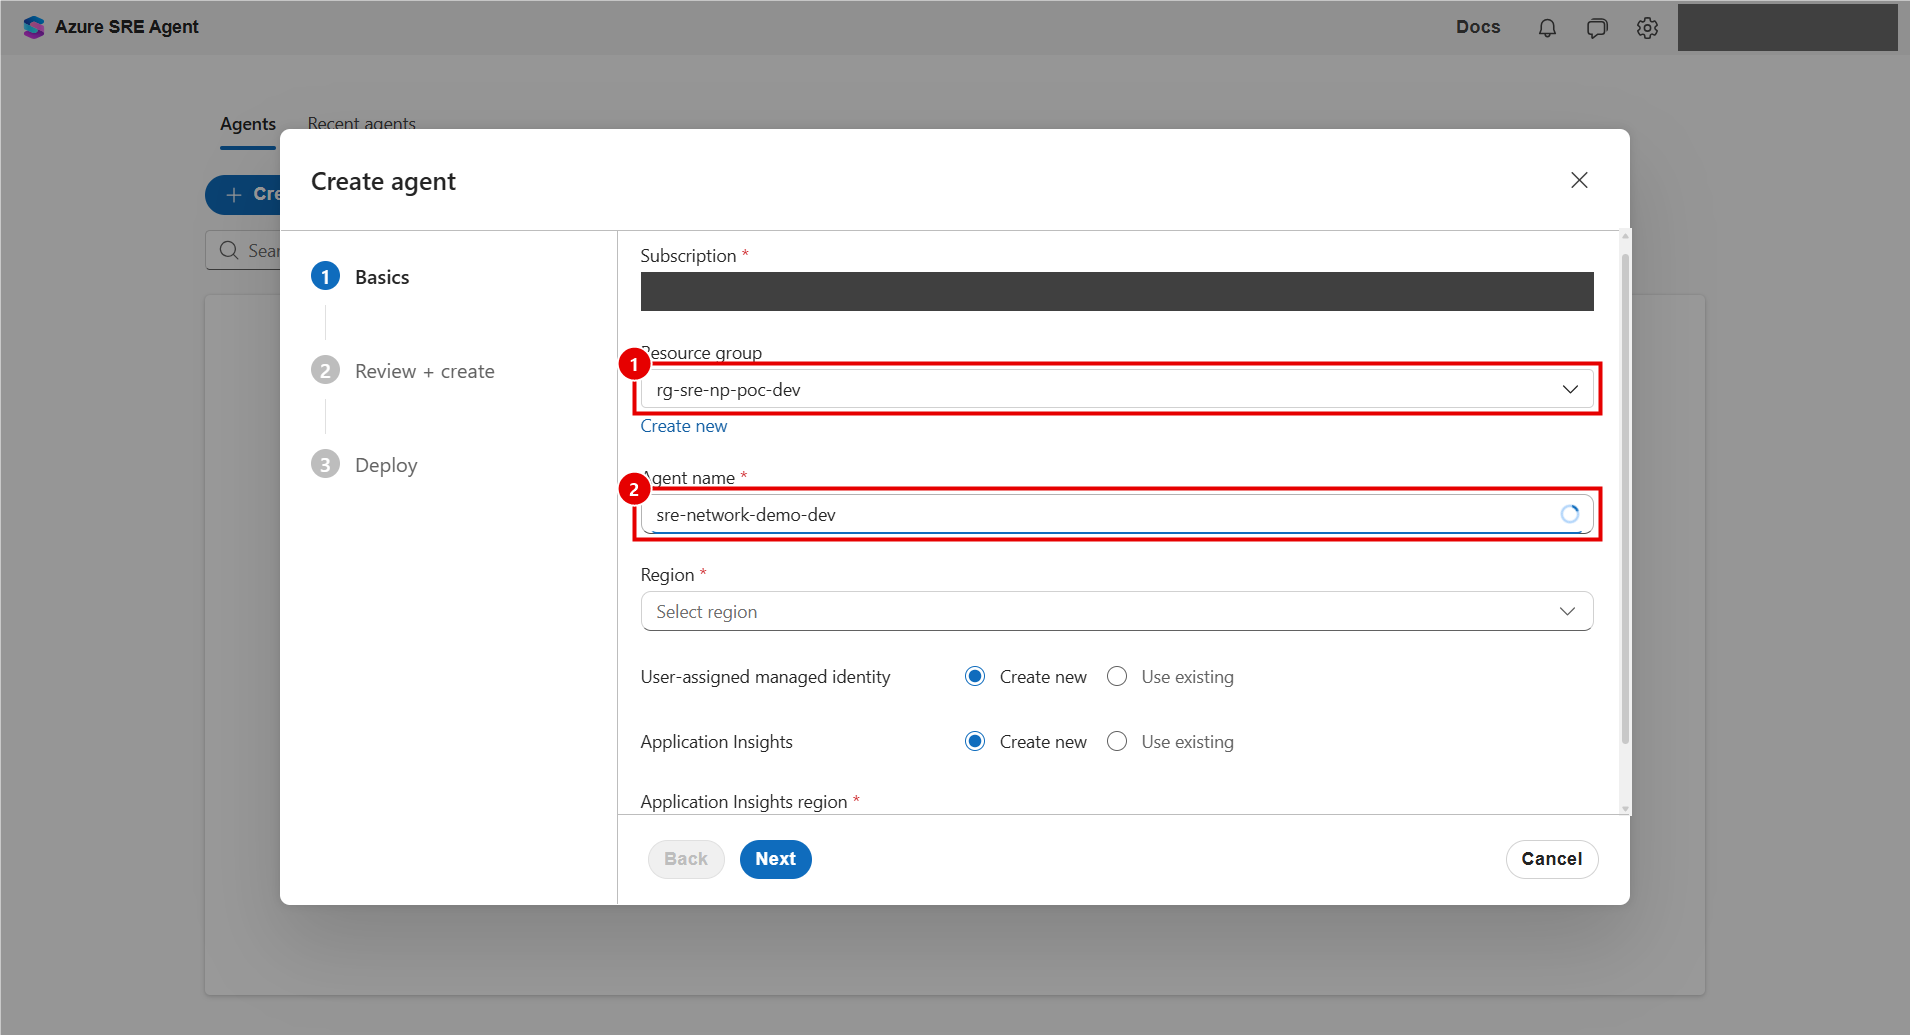
We selected Sweden Central for both the agent and Application Insights, and Azure OpenAI (1x) as the model provider. The form also offers Anthropic (3x), which we did not use here. The multipliers describe the provider choices, not the total cost.
Review the Dependencies, Not Just the Agent Name
Review + create showed the expected name, region and resource group. A green check here only answers the form-validation question. The wizard's Create new monitoring option also creates an Application Insights resource, a Log Analytics workspace, a managed identity and role assignments, and the review page shows neither their final logging settings nor their permissions.
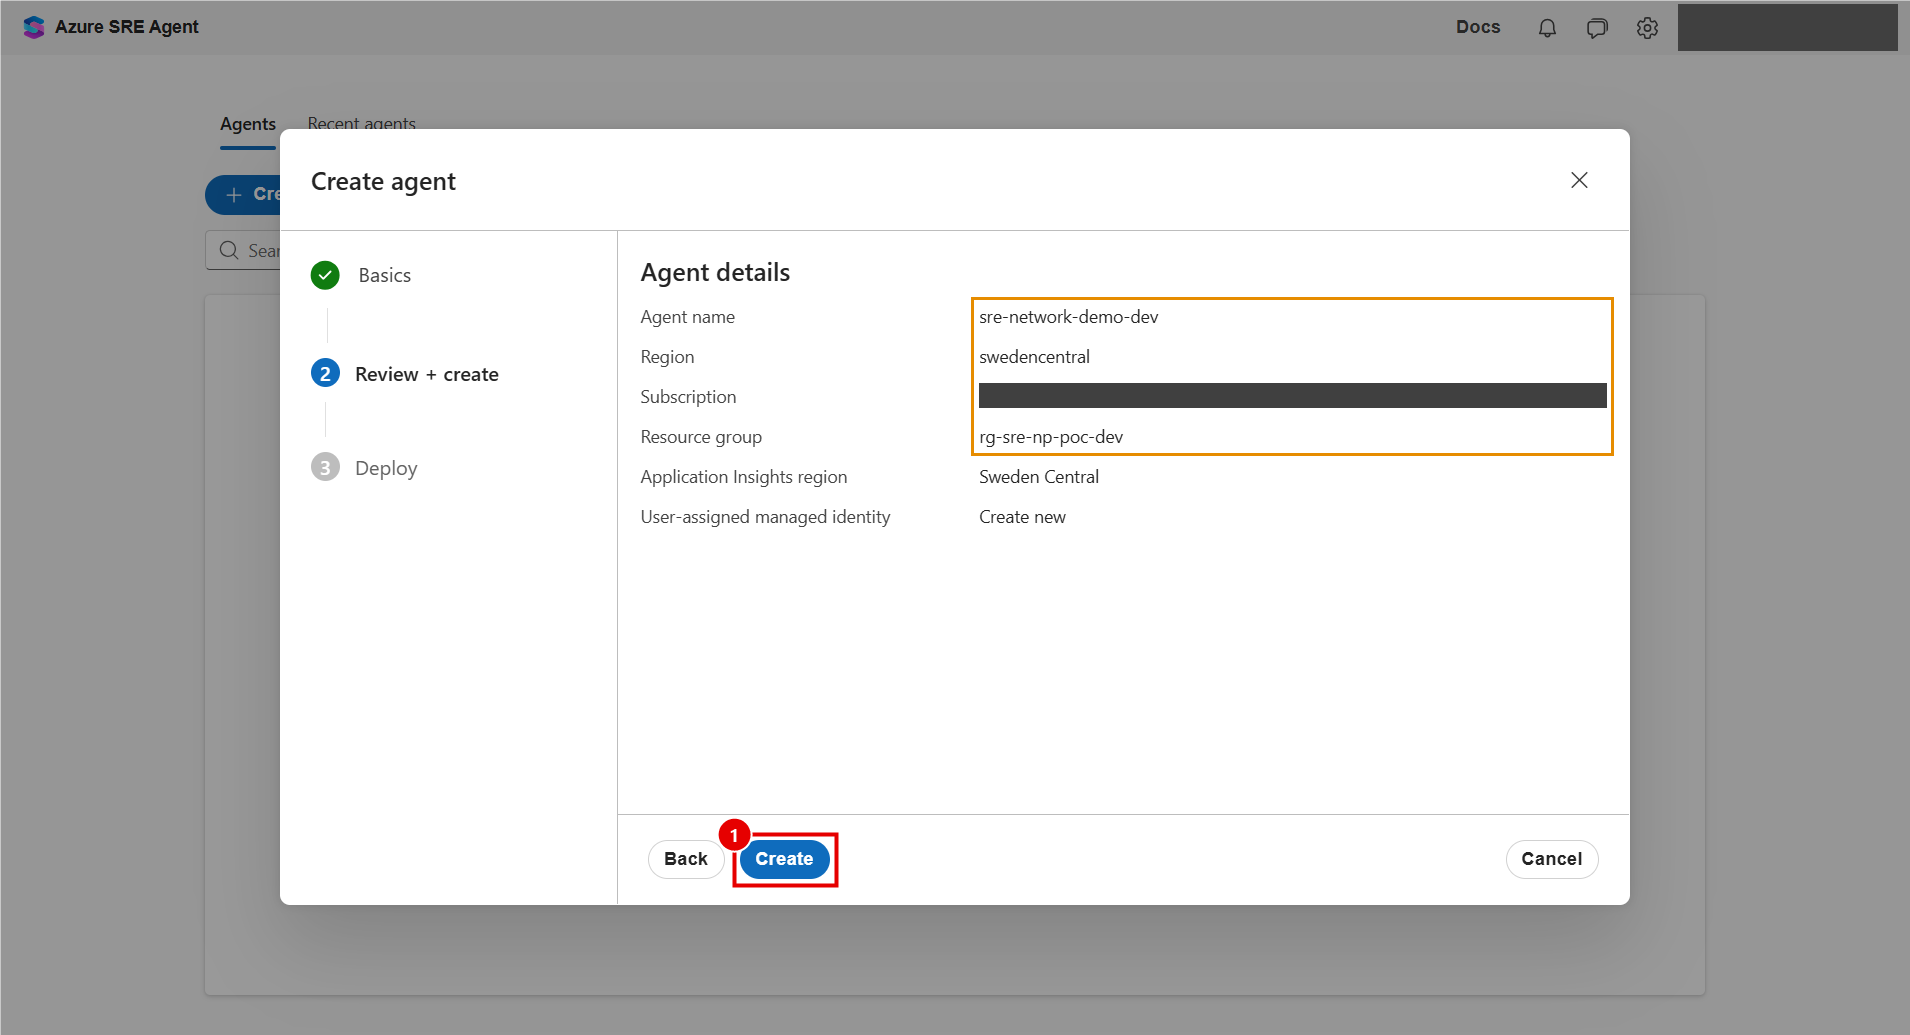
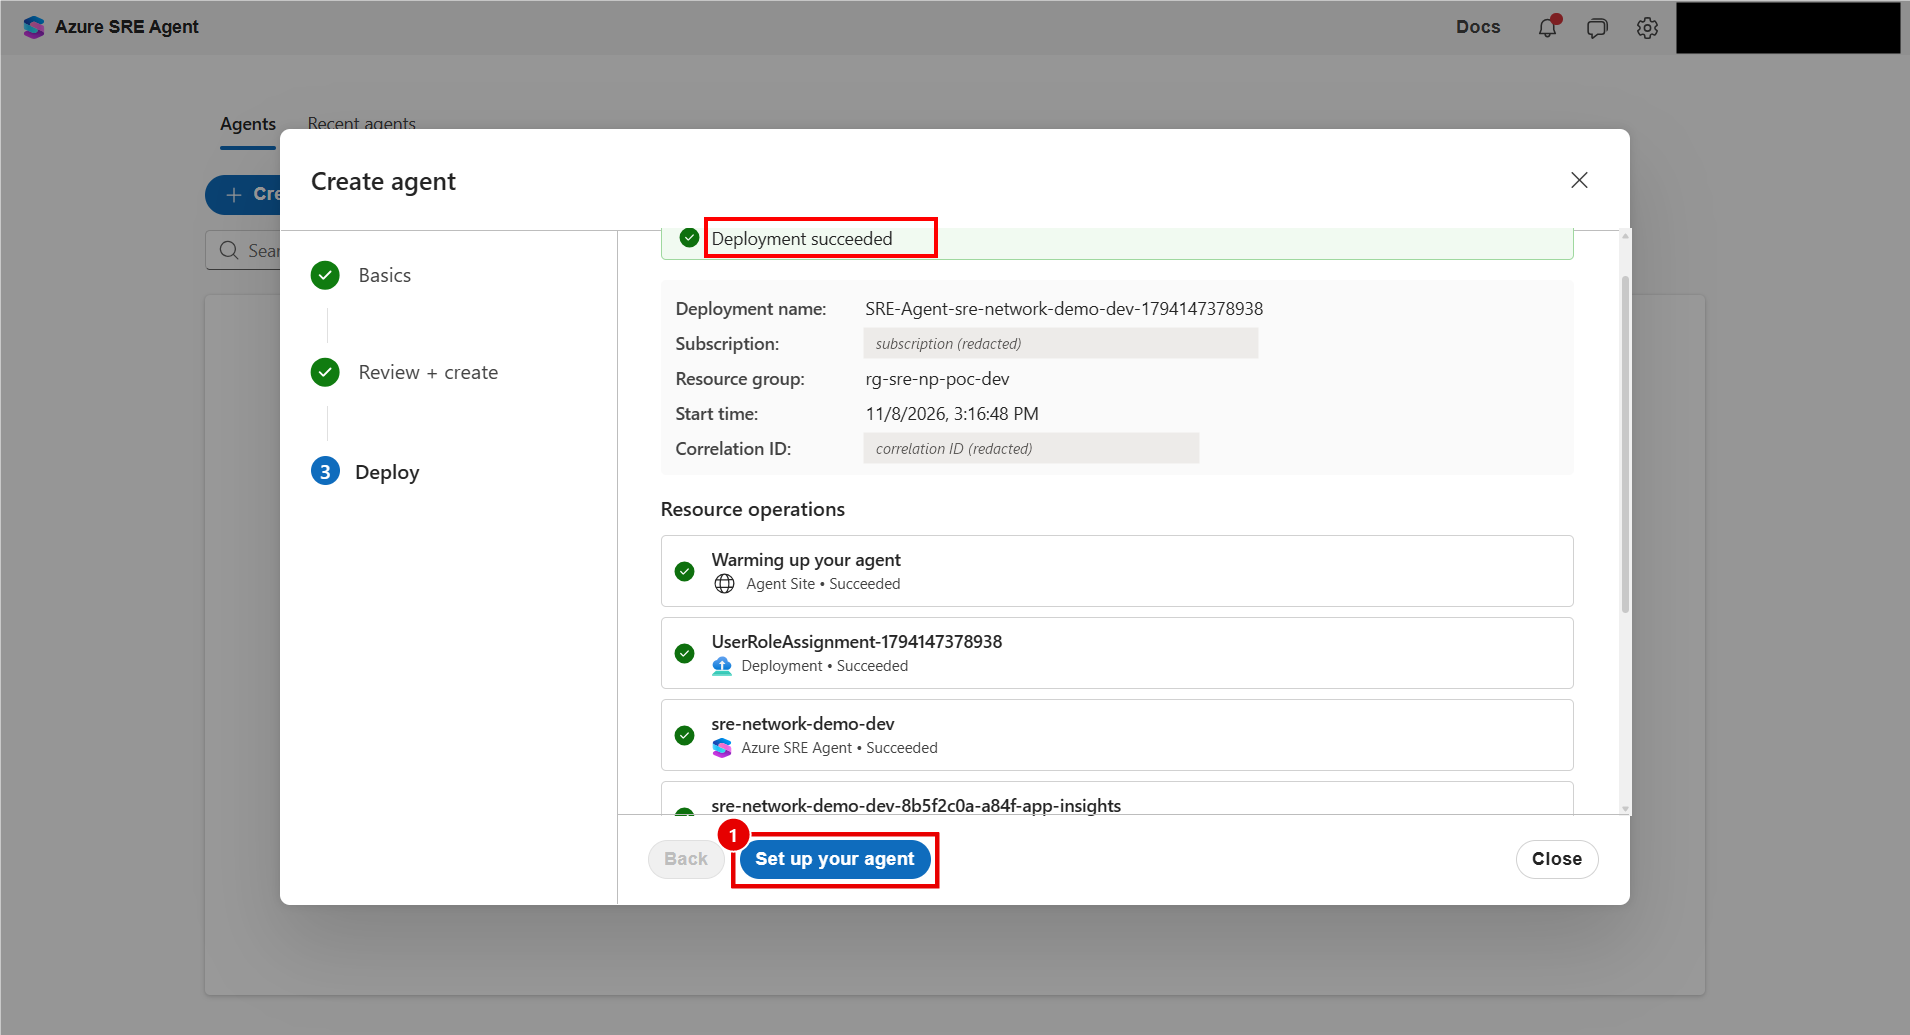
We kept the Create new monitoring choice and selected Create. The deployment reported Deployment succeeded, including sre-network-demo-dev itself.
Check What the Wizard Actually Created
Reading the deployment back in Cloud Shell showed two things the portal does not display:
- a Log Analytics workspace in Sweden Central with 30-day retention and no daily ingestion cap (the daily quota reads -1, which means uncapped, not free);
- a user-assigned managed identity with Monitoring Contributor on rg-sre-np-poc-dev, scoped to the resource group rather than the subscription.
Monitoring Contributor is not a read-only role, and an uncapped workspace is not a spending control. The SRE Agent permissions documentation also describes automatic onboarding that can grant subscription-level Monitoring Contributor even when you choose Reader, so always read back what was actually granted. For a short-lived environment these defaults are acceptable as a deliberate decision. For production we recommend scoping the identity to reader roles and setting a daily ingestion cap. Automatic resource onboarding and incident triggers were left disabled, and no delegated (on-behalf-of, OBO) access was granted. The agent can still ask to re-run an individual command with the operator's credentials; as the investigation shows, we declined.
PowerShell commands: inventory the resources and read back the workspace and identity
$Resources = @(az resource list --resource-group $ResourceGroup --output json |
    ConvertFrom-Json)
if ($LASTEXITCODE -ne 0) { throw 'Resource inventory failed' }

$Resources | Select-Object name, type, location$Workspaces = @($Resources | Where-Object {
$_.type -eq 'Microsoft.OperationalInsights/workspaces'
})
if ($Workspaces.Count -ne 1) { throw 'Review the workspace inventory before continuing' }
$WorkspaceName = $Workspaces[0].name
az monitor log-analytics workspace show `
--resource-group $ResourceGroup `
--workspace-name $WorkspaceName `
--query '{name:name,region:location,retention:retentionInDays,dailyCapGb:workspaceCapping.dailyQuotaGb,state:provisioningState}' `
--output json
if ($LASTEXITCODE -ne 0) { throw 'Workspace readback failed' }$Identities = @($Resources | Where-Object {
$_.type -eq 'Microsoft.ManagedIdentity/userAssignedIdentities'
})
if ($Identities.Count -ne 1) { throw 'Review the identity inventory before continuing' }
$Identity = az identity show --ids $Identities[0].id --output json | ConvertFrom-Json
if ($LASTEXITCODE -ne 0) { throw 'Identity lookup failed' }
$Assignments = @(az role assignment list --all --output json | ConvertFrom-Json)
if ($LASTEXITCODE -ne 0) { throw 'Role assignment lookup failed' }
$Assignments |
Where-Object { $_.principalId -eq $Identity.principalId } |
Select-Object roleDefinitionName, scopeBuilding the Images and the Cluster
With the agent in place, the next step is the platform it will investigate. Everything is driven by a small set of numbered scripts in Cloud Shell, and each script reads its settings from one shared file, 00-variables.ps1, so there is a single place to edit.
Get the Source into Cloud Shell
The two services, the Kubernetes manifests and the numbered scripts are published with this article. The commands below download all 24 files into ~/poc-source in Cloud Shell and set the subscription that every script uses.
PowerShell commands: download the source and set the subscription
$Base = 'https://vakhsha.com/assets/blog/blog-20/poc-source'
$Files = @(
    '.dockerignore', 'constraints.txt', 'requirements-test.txt',
    'kubernetes/namespaces.yaml', 'kubernetes/workloads.yaml',
    'kubernetes/default-deny-backend.yaml', 'kubernetes/allow-frontend-backend.yaml',
    'kubernetes/negative-test-pods.yaml',
    'network-demo-frontend/Dockerfile', 'network-demo-frontend/app.py',
    'network-demo-frontend/requirements.txt',
    'network-demo-backend/Dockerfile', 'network-demo-backend/app.py',
    'network-demo-backend/requirements.txt',
    'scripts/00-variables.ps1', 'scripts/01-build-images.ps1',
    'scripts/02-create-aks.ps1', 'scripts/03-deploy-workloads.ps1',
    'scripts/04-test-connectivity.ps1', 'scripts/05-introduce-fault.ps1',
    'scripts/06-apply-mitigation.ps1', 'scripts/07-negative-tests.ps1',
    'scripts/08-query-logs.ps1', 'scripts/09-cleanup.ps1'
)
foreach ($File in $Files) {
    $Target = Join-Path $HOME "poc-source/$File"
    New-Item -ItemType Directory -Force -Path (Split-Path $Target) | Out-Null
    Invoke-WebRequest -Uri "$Base/$File" -OutFile $Target -ErrorAction Stop
}
"Downloaded $($Files.Count) files to ~/poc-source"

$env:POC_SUBSCRIPTION_ID = Read-Host 'Enter your test subscription ID'
An operational note: Cloud Shell sessions are ephemeral. If the portal session expires, or after you move between the Azure portal and the SRE Agent portal, Cloud Shell can return with an empty home directory while anything already running continues in Azure. Run the download commands again and set the subscription again. Once the cluster exists, also fetch its credentials again, because scripts 04 to 07 call kubectl directly. The scripts skip resources that already exist.
PowerShell commands: restore cluster access after a session reset
az aks get-credentials --resource-group rg-sre-np-poc-dev --name aks-sre-np-poc-dev --admin --overwrite-existingShared Values
The shared file pins the Python base image by digest and re-checks the subscription every time a script starts, because a new Cloud Shell session can default to a different subscription.
Script file: poc-source/scripts/00-variables.ps1
$ErrorActionPreference = 'Stop'

if (-not $env:POC_SUBSCRIPTION_ID) {
    throw 'Set $env:POC_SUBSCRIPTION_ID to your test subscription ID first.'
}

$SubscriptionId = $env:POC_SUBSCRIPTION_ID
$ResourceGroup = 'rg-sre-np-poc-dev'
$NodeResourceGroup = 'rg-sre-np-poc-dev-nodes'
$Location = 'swedencentral'
# Registry names are global; override with $env:POC_REGISTRY_NAME if this one is taken.
$RegistryName = if ($env:POC_REGISTRY_NAME) { $env:POC_REGISTRY_NAME } else { 'acrsrenppocdev1108' }
$ClusterName = 'aks-sre-np-poc-dev'
$VnetName = 'vnet-sre-np-poc-dev'
$SubnetName = 'snet-aks-nodes'
$KubernetesVersion = '1.36.5'
$NodeSize = 'Standard_D4as_v7'
$ImageTag = '0.1.0'
$PythonBase = 'docker.io/library/python:3.12-slim-bookworm@sha256:935c3c5b12357a7e10caa9c1e6ca5692344d97cf229832ef584be2cec9fc03df'
$Tags = @('project=aks-networkpolicy-sre-poc', 'budget-eur=160', 'retention-hours=48')
$SourceRoot = Split-Path $PSScriptRoot -Parent

az account set --subscription $SubscriptionId
if ($LASTEXITCODE -ne 0) { throw 'Could not select the subscription.' }
$Account = az account show --output json | ConvertFrom-Json
if ($Account.id -ne $SubscriptionId -or $Account.state -ne 'Enabled') {
    throw 'Unexpected or disabled subscription context.'
}
Script 01: Registry and Cloud Builds
No local Docker is needed: az acr build uploads the source and builds each image inside the registry. Both builds succeeded. The registry's admin user stays disabled, because AKS pulls images with its managed identity.
Script file: poc-source/scripts/01-build-images.ps1
. (Join-Path $PSScriptRoot '00-variables.ps1')

$Existing = az acr list --resource-group $ResourceGroup --query "[?name=='$RegistryName'].name" --output tsv
if (-not $Existing) {
    $Available = az acr check-name --name $RegistryName --query nameAvailable --output tsv
    if ($Available -ne 'true') { throw "Registry name '$RegistryName' is not available." }

    az acr create `
        --resource-group $ResourceGroup `
        --name $RegistryName `
        --location $Location `
        --sku Basic `
        --admin-enabled false `
        --tags $Tags `
        --output none
    if ($LASTEXITCODE -ne 0) { throw 'Registry creation failed.' }
}

Push-Location $SourceRoot
try {
    foreach ($Service in 'network-demo-frontend', 'network-demo-backend') {
        $Log = Join-Path $HOME "acr-build-$Service.log"
        az acr build `
            --registry $RegistryName `
            --image "${Service}:$ImageTag" `
            --file "$Service/Dockerfile" `
            --build-arg "PYTHON_BASE=$PythonBase" `
            --platform linux/amd64 `
            . *> $Log
        if ($LASTEXITCODE -ne 0) {
            Get-Content $Log -Tail 40
            throw "Cloud build failed for $Service."
        }
        "Built ${Service}:$ImageTag (log: $Log)"
    }
}
finally {
    Pop-Location
}

foreach ($Service in 'network-demo-frontend', 'network-demo-backend') {
    az acr repository show `
        --name $RegistryName `
        --image "${Service}:$ImageTag" `
        --query '{image:name,digest:digest,created:createdTime}' `
        --output json
}
Script 02: Network and AKS
This is where the architecture becomes configuration. Azure CNI Overlay gives pods addresses from 10.244.0.0/16, separate from the node subnet 10.40.1.0/24. The Cilium dataplane enforces Kubernetes NetworkPolicy. Microsoft Entra ID integration with Azure RBAC lets the agent's identity read the cluster through Azure roles later.
Script file: poc-source/scripts/02-create-aks.ps1
. (Join-Path $PSScriptRoot '00-variables.ps1')

$Vnet = az network vnet list --resource-group $ResourceGroup --query "[?name=='$VnetName'].name" --output tsv
if (-not $Vnet) {
    az network vnet create `
        --resource-group $ResourceGroup `
        --name $VnetName `
        --location $Location `
        --address-prefixes 10.40.0.0/16 `
        --subnet-name $SubnetName `
        --subnet-prefixes 10.40.1.0/24 `
        --tags $Tags `
        --output none
    if ($LASTEXITCODE -ne 0) { throw 'Virtual network creation failed.' }
}
$SubnetId = az network vnet subnet show `
    --resource-group $ResourceGroup --vnet-name $VnetName --name $SubnetName `
    --query id --output tsv

$Workspaces = @(az monitor log-analytics workspace list --resource-group $ResourceGroup --query '[].id' --output tsv)
if ($Workspaces.Count -ne 1) { throw 'Expected exactly one Log Analytics workspace in the lab group.' }

$Cluster = az aks list --resource-group $ResourceGroup --query "[?name=='$ClusterName'].name" --output tsv
if (-not $Cluster) {
    # --no-wait keeps the deployment running in Azure if Cloud Shell disconnects.
    az aks create `
        --resource-group $ResourceGroup `
        --name $ClusterName `
        --location $Location `
        --kubernetes-version $KubernetesVersion `
        --tier free `
        --nodepool-name system `
        --node-count 2 `
        --node-vm-size $NodeSize `
        --network-plugin azure `
        --network-plugin-mode overlay `
        --network-dataplane cilium `
        --pod-cidr 10.244.0.0/16 `
        --service-cidr 10.96.0.0/16 `
        --dns-service-ip 10.96.0.10 `
        --vnet-subnet-id $SubnetId `
        --node-resource-group $NodeResourceGroup `
        --enable-managed-identity `
        --enable-aad `
        --enable-azure-rbac `
        --enable-addons monitoring `
        --workspace-resource-id $Workspaces[0] `
        --auto-upgrade-channel none `
        --node-os-upgrade-channel None `
        --no-ssh-key `
        --tags $Tags `
        --no-wait `
        --output none
    if ($LASTEXITCODE -ne 0) { throw 'AKS create request failed.' }
}

az aks wait --resource-group $ResourceGroup --name $ClusterName --created --interval 30 --timeout 2400
if ($LASTEXITCODE -ne 0) { throw 'AKS did not reach a created state.' }

# --attach-acr is rejected together with --no-wait, so the pull permission is granted afterwards.
az aks update `
    --resource-group $ResourceGroup `
    --name $ClusterName `
    --attach-acr $RegistryName `
    --output none
if ($LASTEXITCODE -ne 0) { throw 'Registry attachment failed.' }

# System pools only accept maxUnavailable 0, so a zero-surge upgrade is rejected; automatic upgrades stay off instead.

az aks show --resource-group $ResourceGroup --name $ClusterName --query '{
    state:provisioningState,
    version:currentKubernetesVersion,
    tier:sku.tier,
    plugin:networkProfile.networkPlugin,
    pluginMode:networkProfile.networkPluginMode,
    dataplane:networkProfile.networkDataplane,
    policy:networkProfile.networkPolicy,
    podCidr:networkProfile.podCidr,
    serviceCidr:networkProfile.serviceCidr,
    azureRbac:aadProfile.enableAzureRbac,
    nodeResourceGroup:nodeResourceGroup,
    upgrade:agentPoolProfiles[0].upgradeSettings
}' --output json

az aks get-credentials `
    --resource-group $ResourceGroup `
    --name $ClusterName `
    --admin `
    --overwrite-existing `
    --output none
if ($LASTEXITCODE -ne 0) { throw 'Could not retrieve cluster credentials.' }

kubectl get nodes --output wide
Two platform constraints shaped this script, and both are worth knowing:
- --attach-acr cannot be combined with --no-wait. AKS rejects the combination immediately. We kept --no-wait, so the cluster build survives a Cloud Shell disconnect, and attached the registry afterwards.
- System node pools only accept a max unavailable of 0. Because a surge node would exceed the 10-vCPU quota, we tried --max-surge 0 --max-unavailable 1, and AKS replied "System pools can only use max unavailable 0". With a single system pool, a zero-surge upgrade is not possible, so automatic upgrades stay off for this short-lived cluster. In production, plan quota for the surge node instead.
The cluster was ready about six minutes after creation started: two Ready nodes on 1.36.5 with node IPs 10.40.1.4 and 10.40.1.5, running Ubuntu 24.04 and containerd.
Deploying the Workloads and Establishing a Baseline
Script 03: Namespaces, Deployments and Services
The workload manifest uses a REGISTRY_FQDN placeholder that the script replaces with the real registry. Both Deployments run as non-root, with a read-only root filesystem, all capabilities dropped and no service-account token. Both pods were Running within seconds, and each Service had an endpoint; the backend's was 10.244.0.137:3001.
Script file: poc-source/scripts/03-deploy-workloads.ps1
. (Join-Path $PSScriptRoot '00-variables.ps1')

$RegistryServer = az acr show --name $RegistryName --query loginServer --output tsv
if (-not $RegistryServer) { throw 'Registry login server not found.' }
$Manifests = Join-Path $SourceRoot 'kubernetes'

kubectl apply --filename (Join-Path $Manifests 'namespaces.yaml')
if ($LASTEXITCODE -ne 0) { throw 'Namespace deployment failed.' }

(Get-Content (Join-Path $Manifests 'workloads.yaml') -Raw).Replace('REGISTRY_FQDN', $RegistryServer) |
    kubectl apply --filename -
if ($LASTEXITCODE -ne 0) { throw 'Workload deployment failed.' }

kubectl rollout status deployment/network-demo-backend --namespace backend --timeout=180s
kubectl rollout status deployment/network-demo-frontend --namespace frontend --timeout=180s
if ($LASTEXITCODE -ne 0) { throw 'Workloads did not become ready.' }

kubectl get pods,services,endpointslices --namespace frontend --output wide
kubectl get pods,services,endpointslices --namespace backend --output wide
Script 04: Test Every Layer from Inside the Frontend Pod
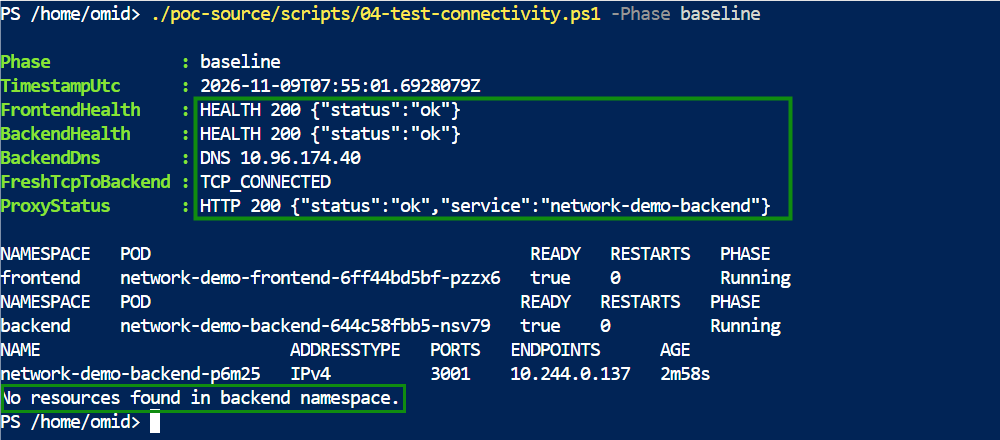
This script is the core of the method. A single "is it up?" check cannot separate the failure modes that matter, so the script tests each layer independently, from inside the frontend pod:
| Check | What a failure would point to |
|---|---|
| FrontendHealth, BackendHealth | The process itself is unhealthy |
| BackendDns | Cluster DNS or the Service name |
| FreshTcpToBackend | Network path or policy: a new TCP connection each run |
| ProxyStatus | The real user request through the proxy |
The TCP probe opens a brand-new connection on every run, so a pooled connection opened before a policy change cannot hide the result.
Script file: poc-source/scripts/04-test-connectivity.ps1
param(
    [Parameter(Mandatory)]
    [ValidateSet('baseline', 'fault', 'recovery')]
    [string] $Phase
)
$ErrorActionPreference = 'Stop'

function Invoke-PodPython {
    param([string] $Namespace, [string] $Target, [string] $Code)
    $Output = kubectl exec --namespace $Namespace $Target -- python -c $Code 2>&1
    ($Output -join ' ').Trim()
}

# Each run opens a new TCP connection; no pooled connection survives a policy change.
$TcpProbe = @'
import socket
try:
    socket.create_connection(("network-demo-backend.backend.svc.cluster.local", 3001), timeout=3).close()
    print("TCP_CONNECTED")
except OSError as error:
    print("TCP_FAILED", type(error).__name__)
'@

$DnsProbe = @'
import socket
print("DNS", socket.gethostbyname("network-demo-backend.backend.svc.cluster.local"))
'@

$ProxyRequest = @'
import urllib.error, urllib.request
try:
    with urllib.request.urlopen("http://127.0.0.1:3000/api/status", timeout=5) as response:
        print("HTTP", response.status, response.read().decode())
except urllib.error.HTTPError as error:
    print("HTTP", error.code, error.read().decode())
'@

$HealthRequest = @'
import sys, urllib.request
with urllib.request.urlopen(f"http://127.0.0.1:{sys.argv[1]}/health", timeout=3) as response:
    print("HEALTH", response.status, response.read().decode())
'@

$Frontend = 'deployment/network-demo-frontend'
$Backend = 'deployment/network-demo-backend'

[pscustomobject][ordered]@{
    Phase = $Phase
    TimestampUtc = (Get-Date).ToUniversalTime().ToString('o')
    FrontendHealth = Invoke-PodPython 'frontend' $Frontend ($HealthRequest -replace 'sys.argv\[1\]', '3000')
    BackendHealth = Invoke-PodPython 'backend' $Backend ($HealthRequest -replace 'sys.argv\[1\]', '3001')
    BackendDns = Invoke-PodPython 'frontend' $Frontend $DnsProbe
    FreshTcpToBackend = Invoke-PodPython 'frontend' $Frontend $TcpProbe
    ProxyStatus = Invoke-PodPython 'frontend' $Frontend $ProxyRequest
} | Format-List

kubectl get pods --namespace frontend --selector app=network-demo-frontend `
    --output custom-columns='NAMESPACE:.metadata.namespace,POD:.metadata.name,READY:.status.containerStatuses[0].ready,RESTARTS:.status.containerStatuses[0].restartCount,PHASE:.status.phase'
kubectl get pods --namespace backend --selector app=network-demo-backend `
    --output custom-columns='NAMESPACE:.metadata.namespace,POD:.metadata.name,READY:.status.containerStatuses[0].ready,RESTARTS:.status.containerStatuses[0].restartCount,PHASE:.status.phase'
kubectl get endpointslices --namespace backend
kubectl get networkpolicies --namespace backend
The baseline at 07:55 UTC was clean: every check passed, the proxy returned HTTP 200, and the backend namespace had no NetworkPolicies.
The Incident: Healthy Pods, Failing Requests
Script 05: Introduce the Fault
Now the incident. The policy below selects every pod in the backend namespace and lists no ingress rules. In Kubernetes, that means: deny all incoming traffic to those pods. Nothing about the pods, images or Services changes.
Manifest file: poc-source/kubernetes/default-deny-backend.yaml
apiVersion: networking.k8s.io/v1
kind: NetworkPolicy
metadata:
  name: default-deny-backend
  namespace: backend
spec:
  podSelector: {}
  policyTypes: [Ingress]
  ingress: []
The script records the exact UTC time, applies the policy and sends twelve real requests through the proxy. That burst matters: it writes structured failure logs to Container Insights, which the agent finds later.
Script file: poc-source/scripts/05-introduce-fault.ps1
$ErrorActionPreference = 'Stop'
$SourceRoot = Split-Path $PSScriptRoot -Parent

$Started = (Get-Date).ToUniversalTime().ToString('o')
kubectl apply --filename (Join-Path $SourceRoot 'kubernetes/default-deny-backend.yaml')
if ($LASTEXITCODE -ne 0) { throw 'Default-deny policy was not applied.' }
"FAULT_APPLIED_UTC=$Started"

# Generate a short burst of real user-path failures for Container Insights to collect.
$Burst = @'
import urllib.error, urllib.request
codes = []
for _ in range(12):
    try:
        with urllib.request.urlopen("http://127.0.0.1:3000/api/status", timeout=5) as response:
            codes.append(response.status)
    except urllib.error.HTTPError as error:
        codes.append(error.code)
print("REQUEST_CODES", codes)
'@
kubectl exec --namespace frontend deployment/network-demo-frontend -- python -c $Burst
The policy was applied at 07:56:04 UTC, and all twelve requests failed.

The Symptom That Misleads
Running script 04 again thirty seconds later shows the picture that gives this article its title:
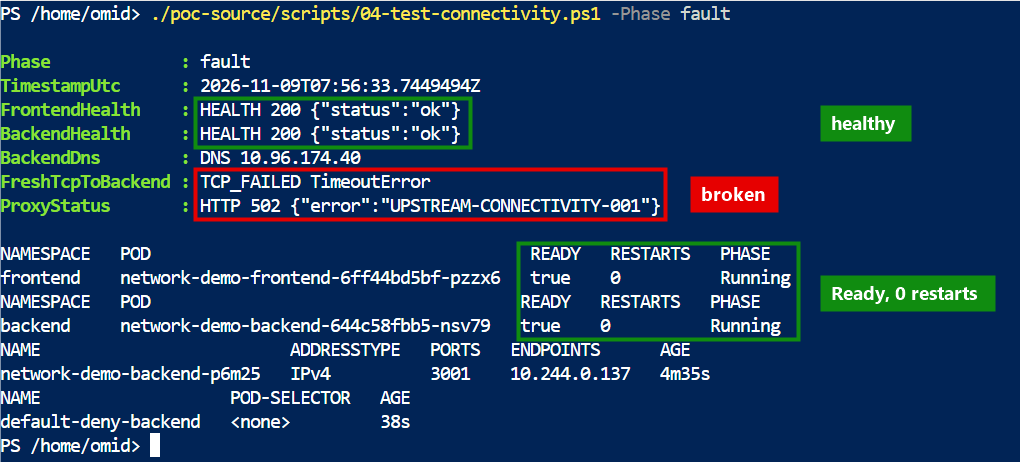
Read it from top to bottom. Both processes are healthy. DNS resolves. The Service still has a ready endpoint, so Kubernetes itself sees nothing wrong. Both pods are Ready with zero restarts, so a restart-based alert would never fire. And yet a fresh TCP connection times out, and every user request gets HTTP 502 UPSTREAM-CONNECTIVITY-001.
The timeout is a clue in itself. A stopped process usually refuses a connection immediately; a silent timeout is what a network policy drop typically looks like. But the engineer on call does not yet know that a policy was added. That is the question we handed to the agent.
Giving the Agent Context
Out of the box, the agent's Quickstart page says plainly that it "doesn't know anything about your app". Two connectors change that.
Connect the Log Analytics Workspace
In sre.azure.com, open the agent, select Logs +, choose Log Analytics Workspace and select Next.
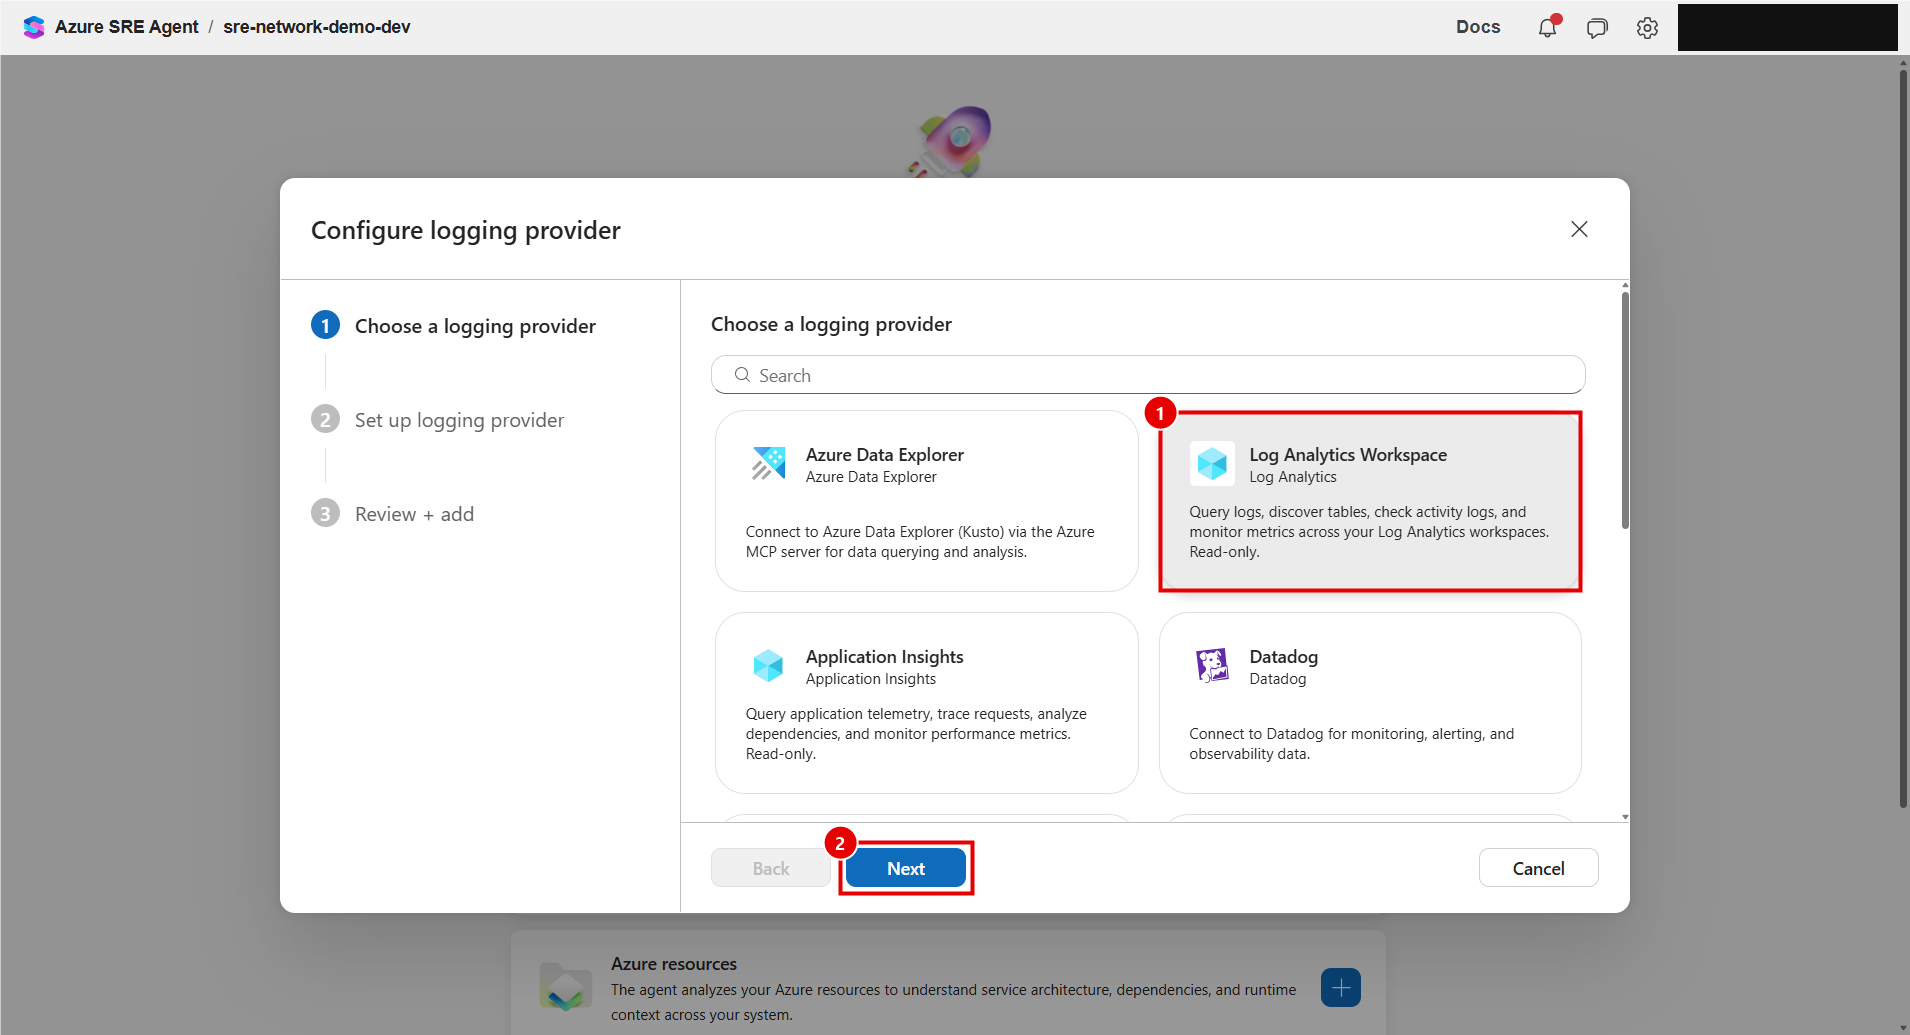
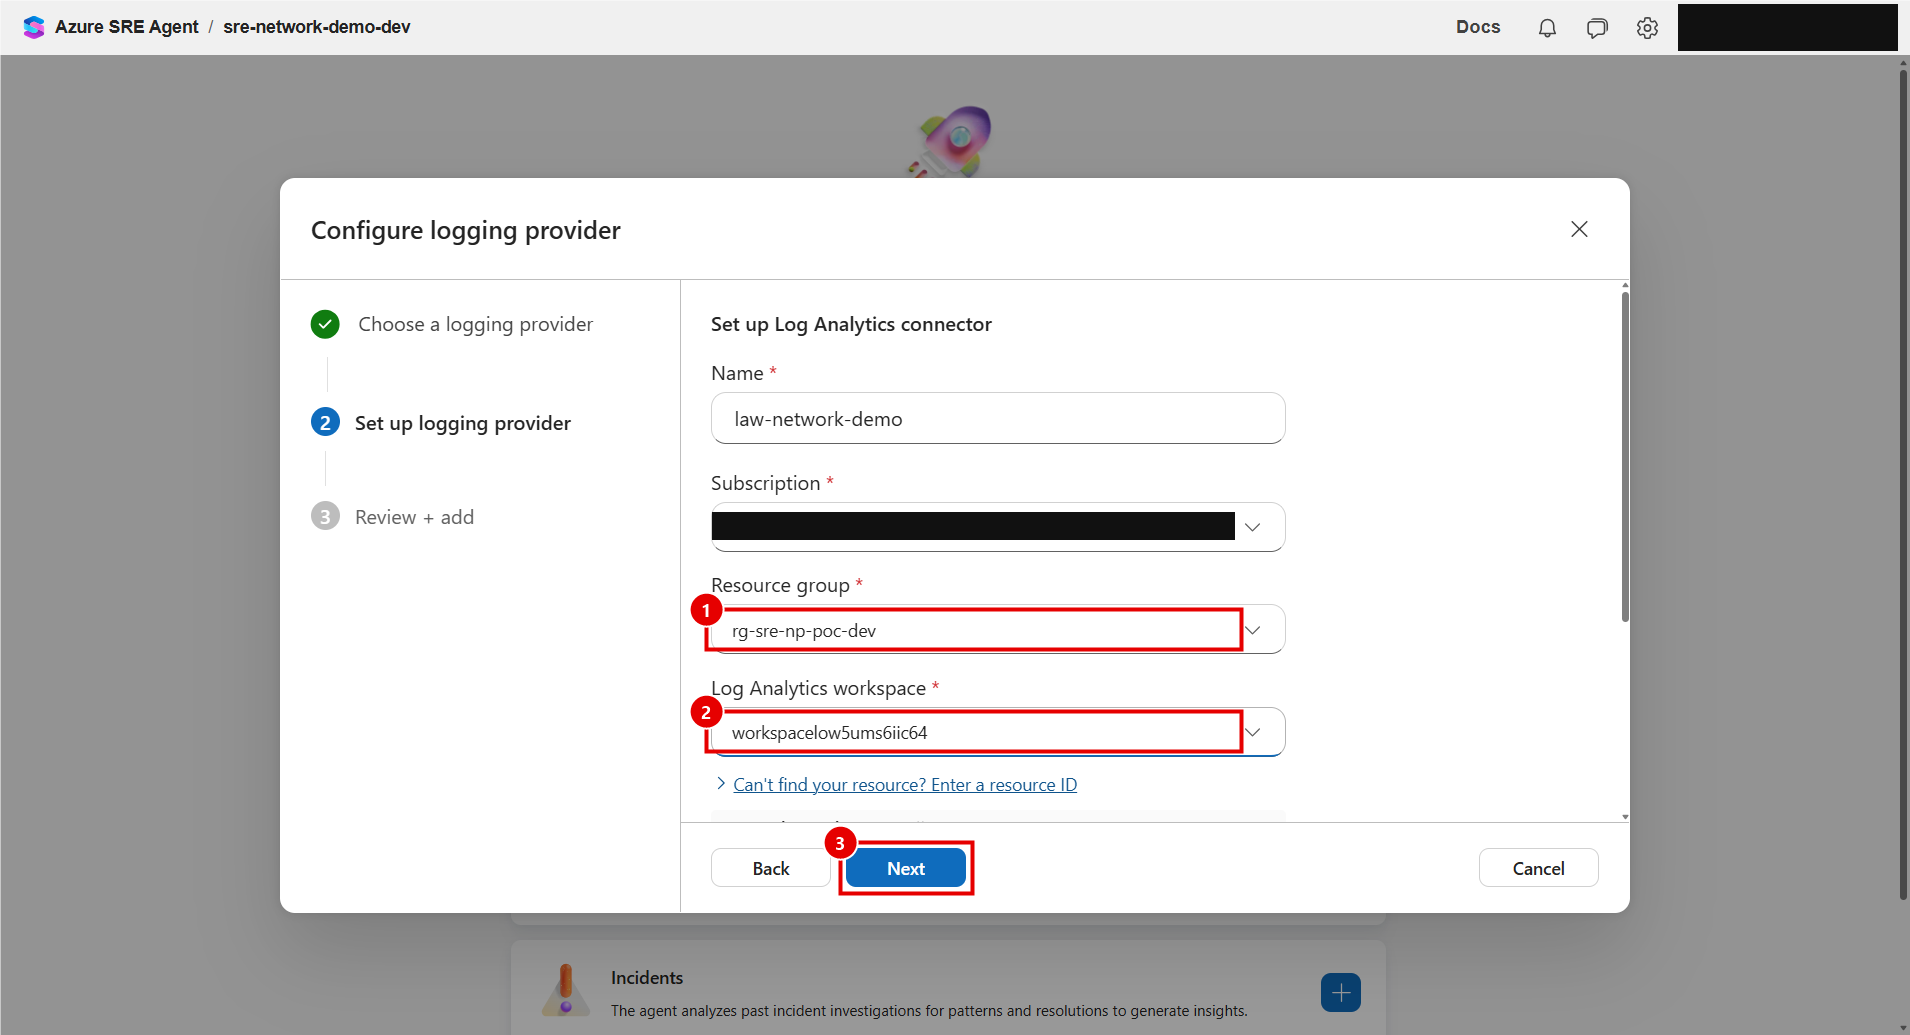
Then select the resource group and the workspace that receives the cluster's container logs. The connector authenticates with the agent's managed identity, not with your personal account.
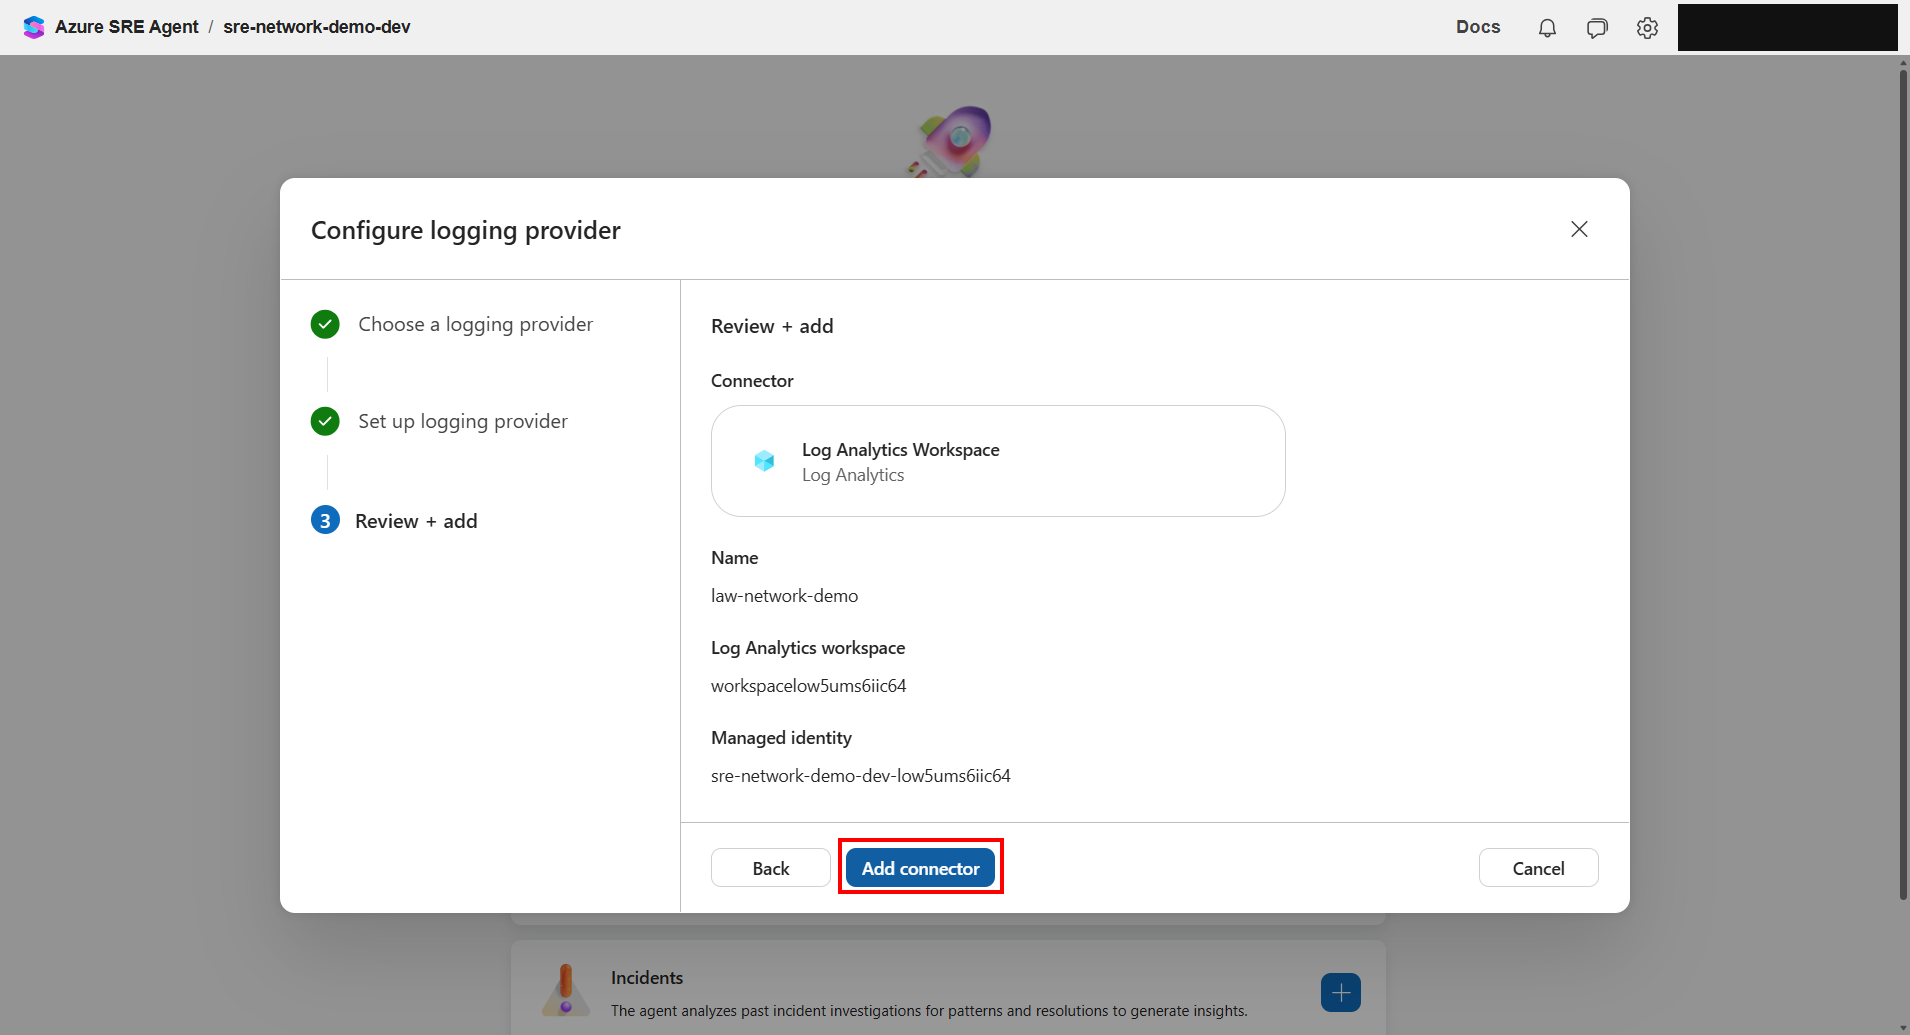
The review page lists exactly what will be added. Add connector saves it, and the portal grants the identity read access to that workspace.
Give Read Access to the Cluster
Logs show that requests fail, not why. To read NetworkPolicies, EndpointSlices and pod labels, the agent needs Kubernetes read access. Under Azure resources > Add resources, we chose Resource group, selected rg-sre-np-poc-dev and kept the permission level at Reader.
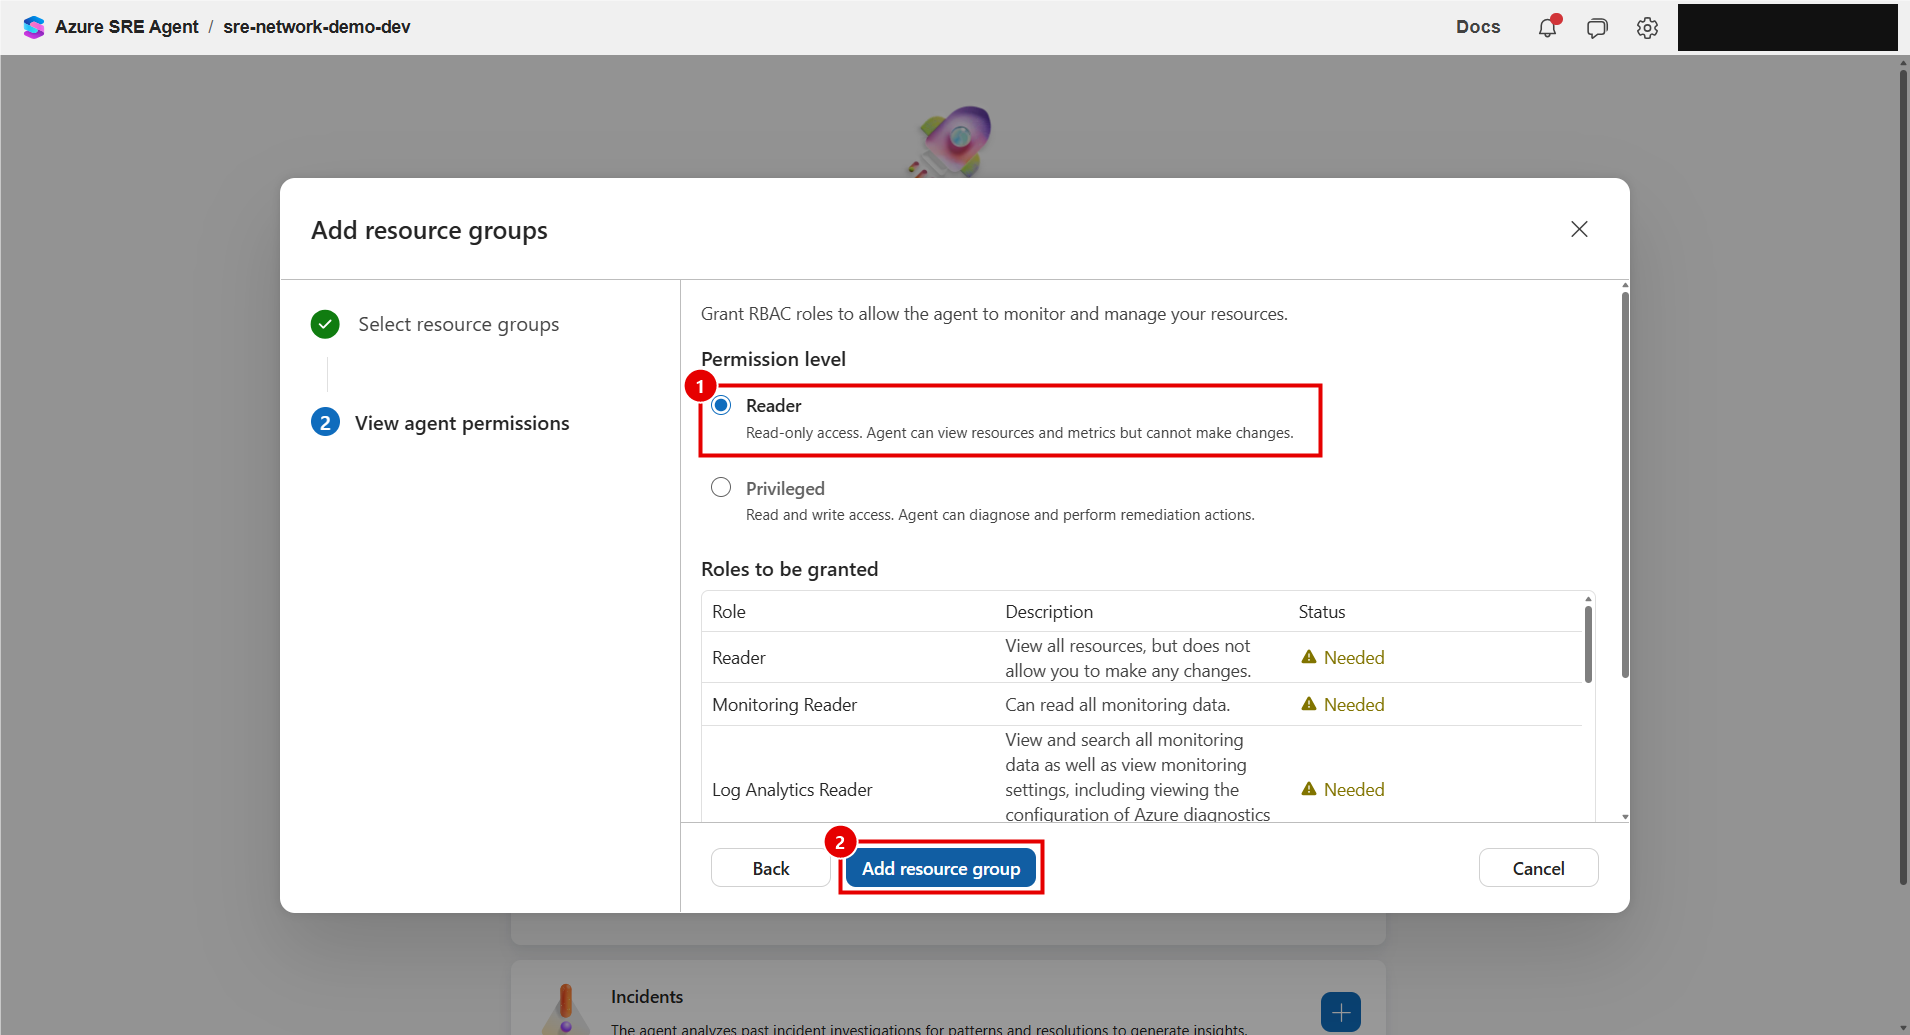
Read this screen carefully, because it shows what "Reader" really means here: Reader, Monitoring Reader, Log Analytics Reader, Azure Kubernetes Service RBAC Reader and Azure Kubernetes Service Cluster User Role, plus an HDInsight Cluster Operator role that the wizard includes for that resource type. There is no HDInsight cluster in this environment, which is a good reminder to read the list instead of trusting the word "Reader". AKS RBAC Reader excludes Secrets, which is a sensible boundary for an investigation agent: it can see the network configuration, not credentials.
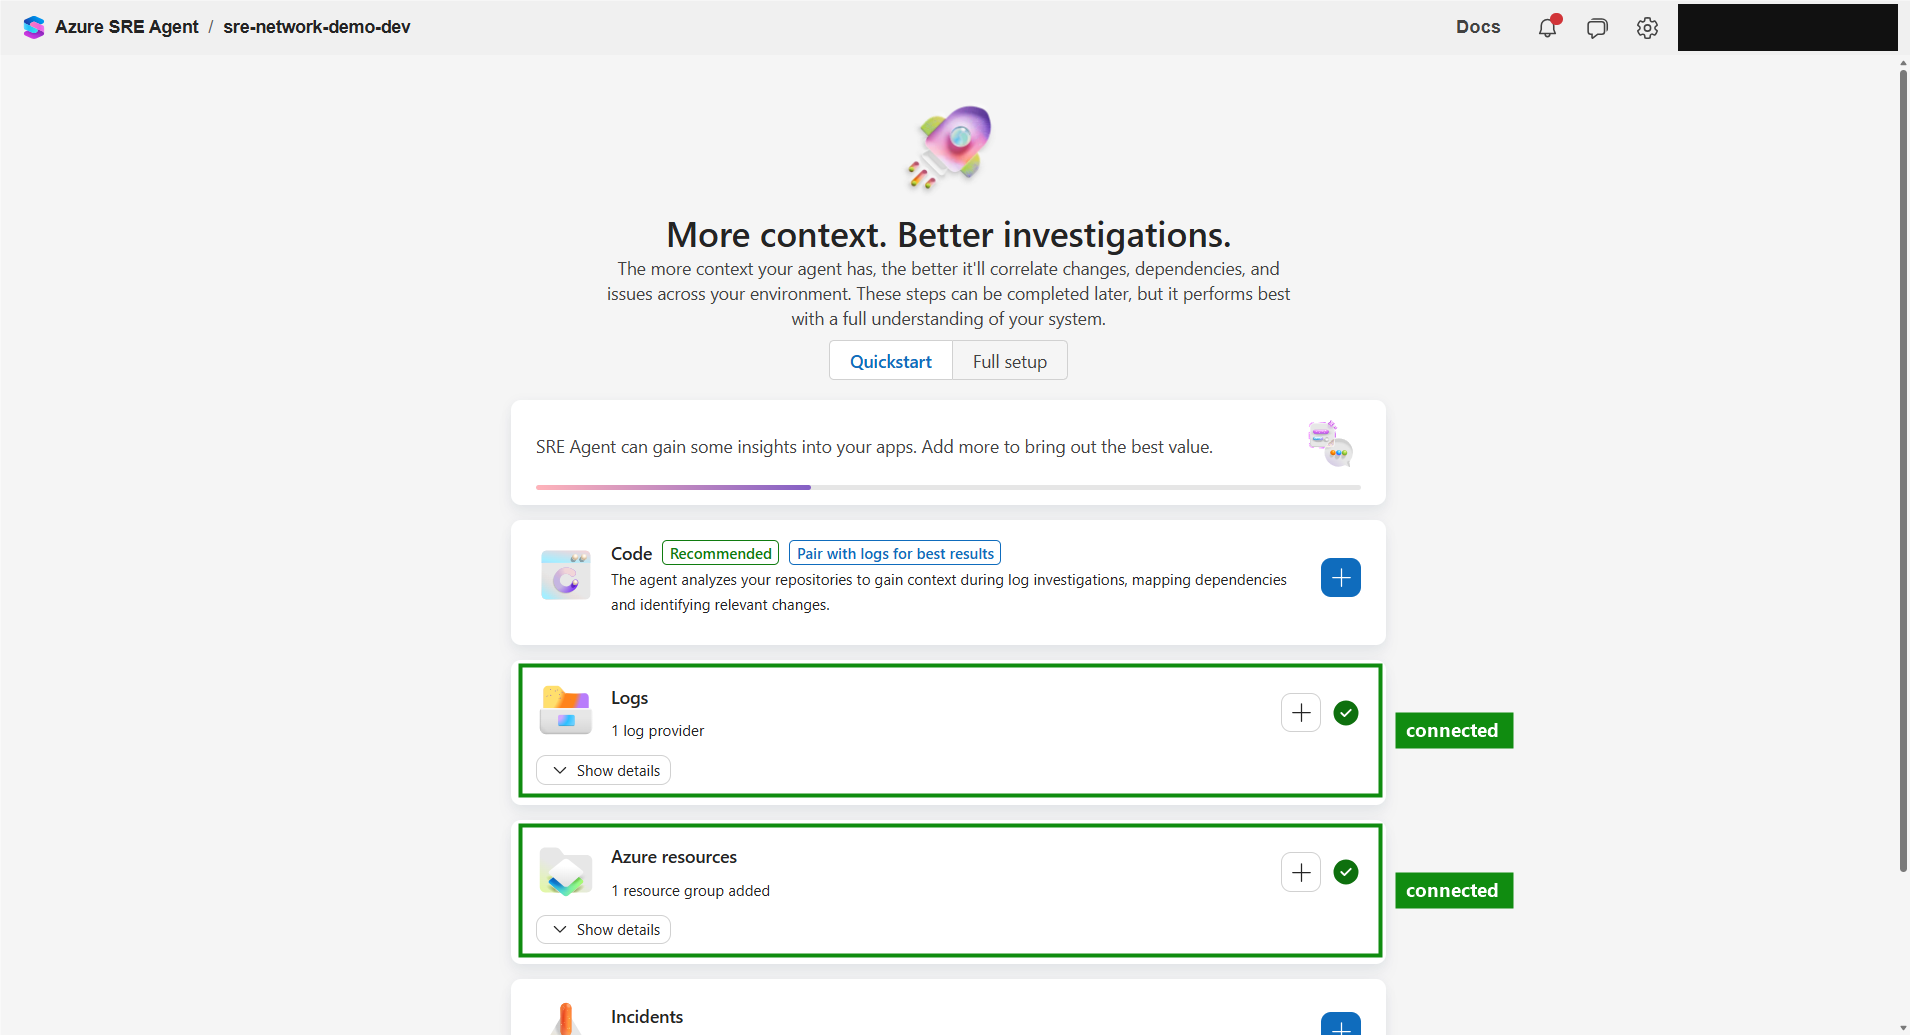
Both cards then showed a green check: one log provider and one resource group added.
Set the Active-Usage Limit Before the First Question
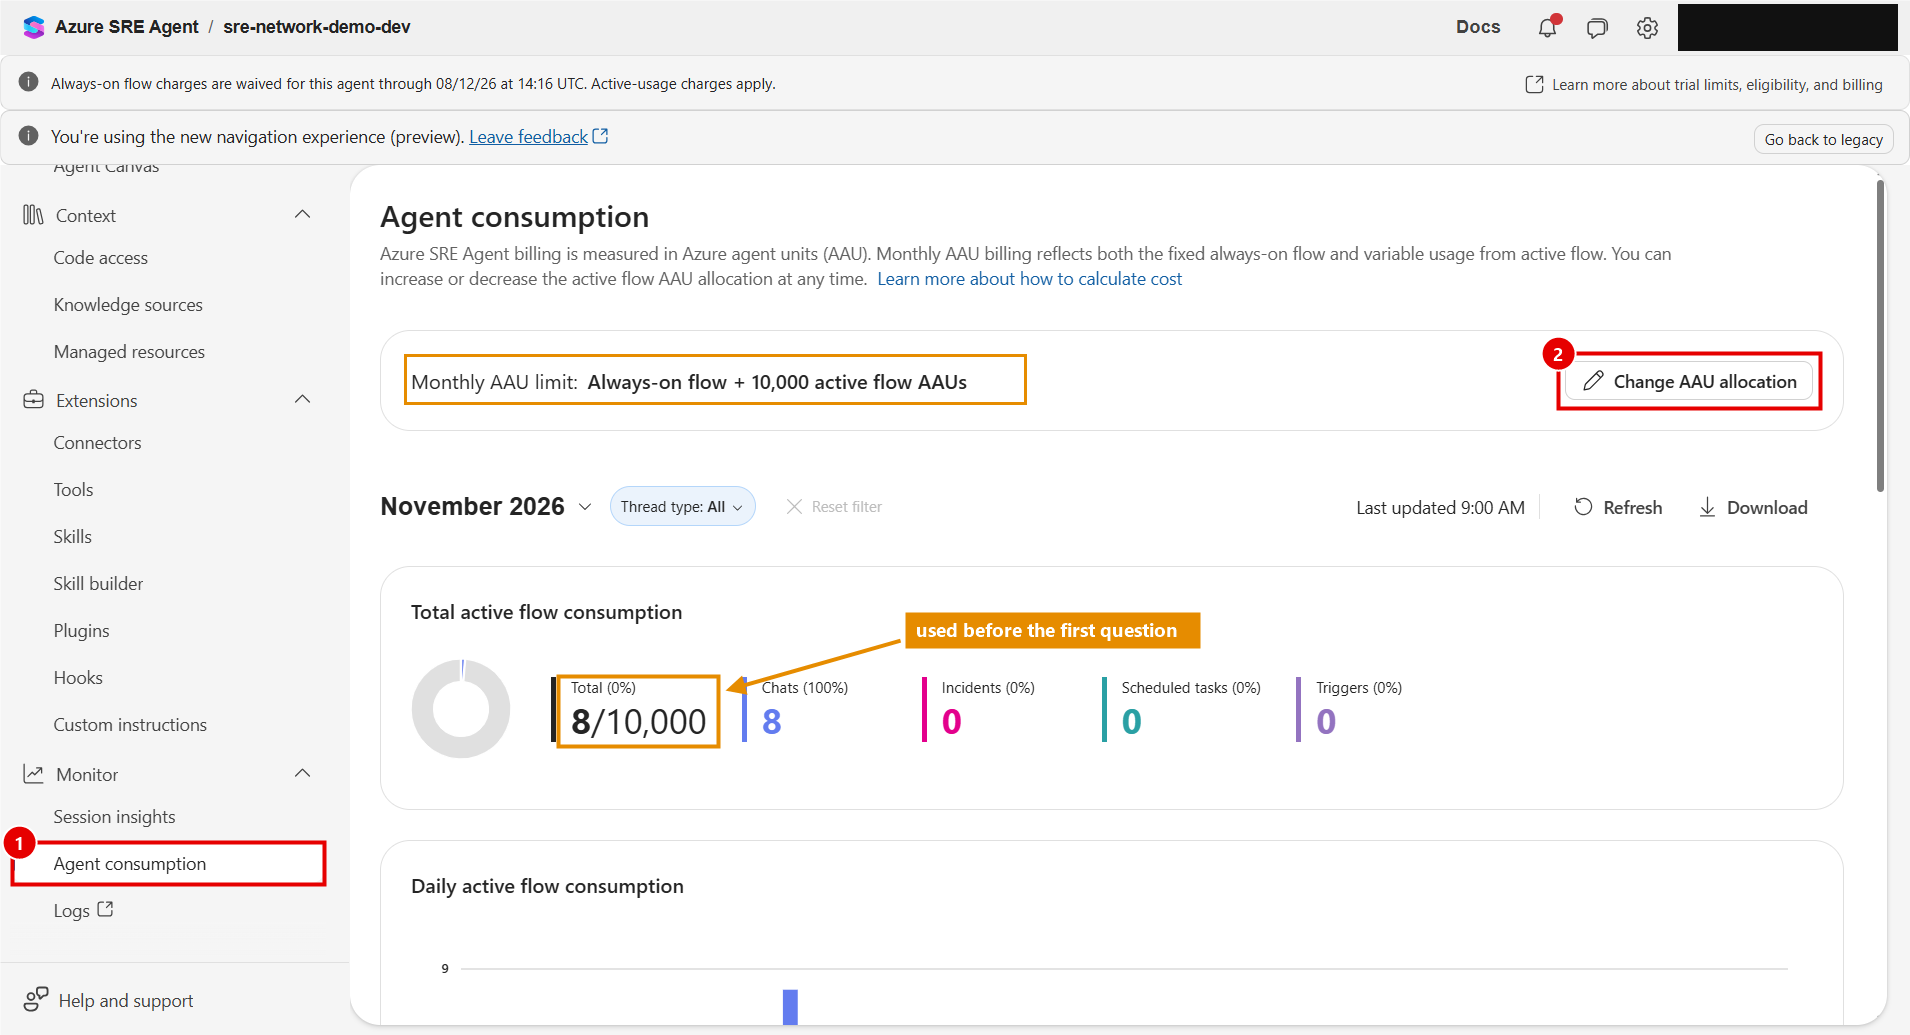
Before asking anything, we opened Build + setup > Monitor > Agent consumption. Two findings here are easy to miss:
- The default monthly active-usage allocation is 10,000 AAU. At EUR 0.0953 per AAU, that allows roughly EUR 950 of active usage per month unless you lower it.
- The counter already showed 8 AAU used before the first question. Selecting Done and go to agent starts an automatic onboarding conversation in which the agent explores what it can see, so usage begins earlier than you might expect.
Change AAU allocation accepts a minimum of 500. We set it to 500 and saved.
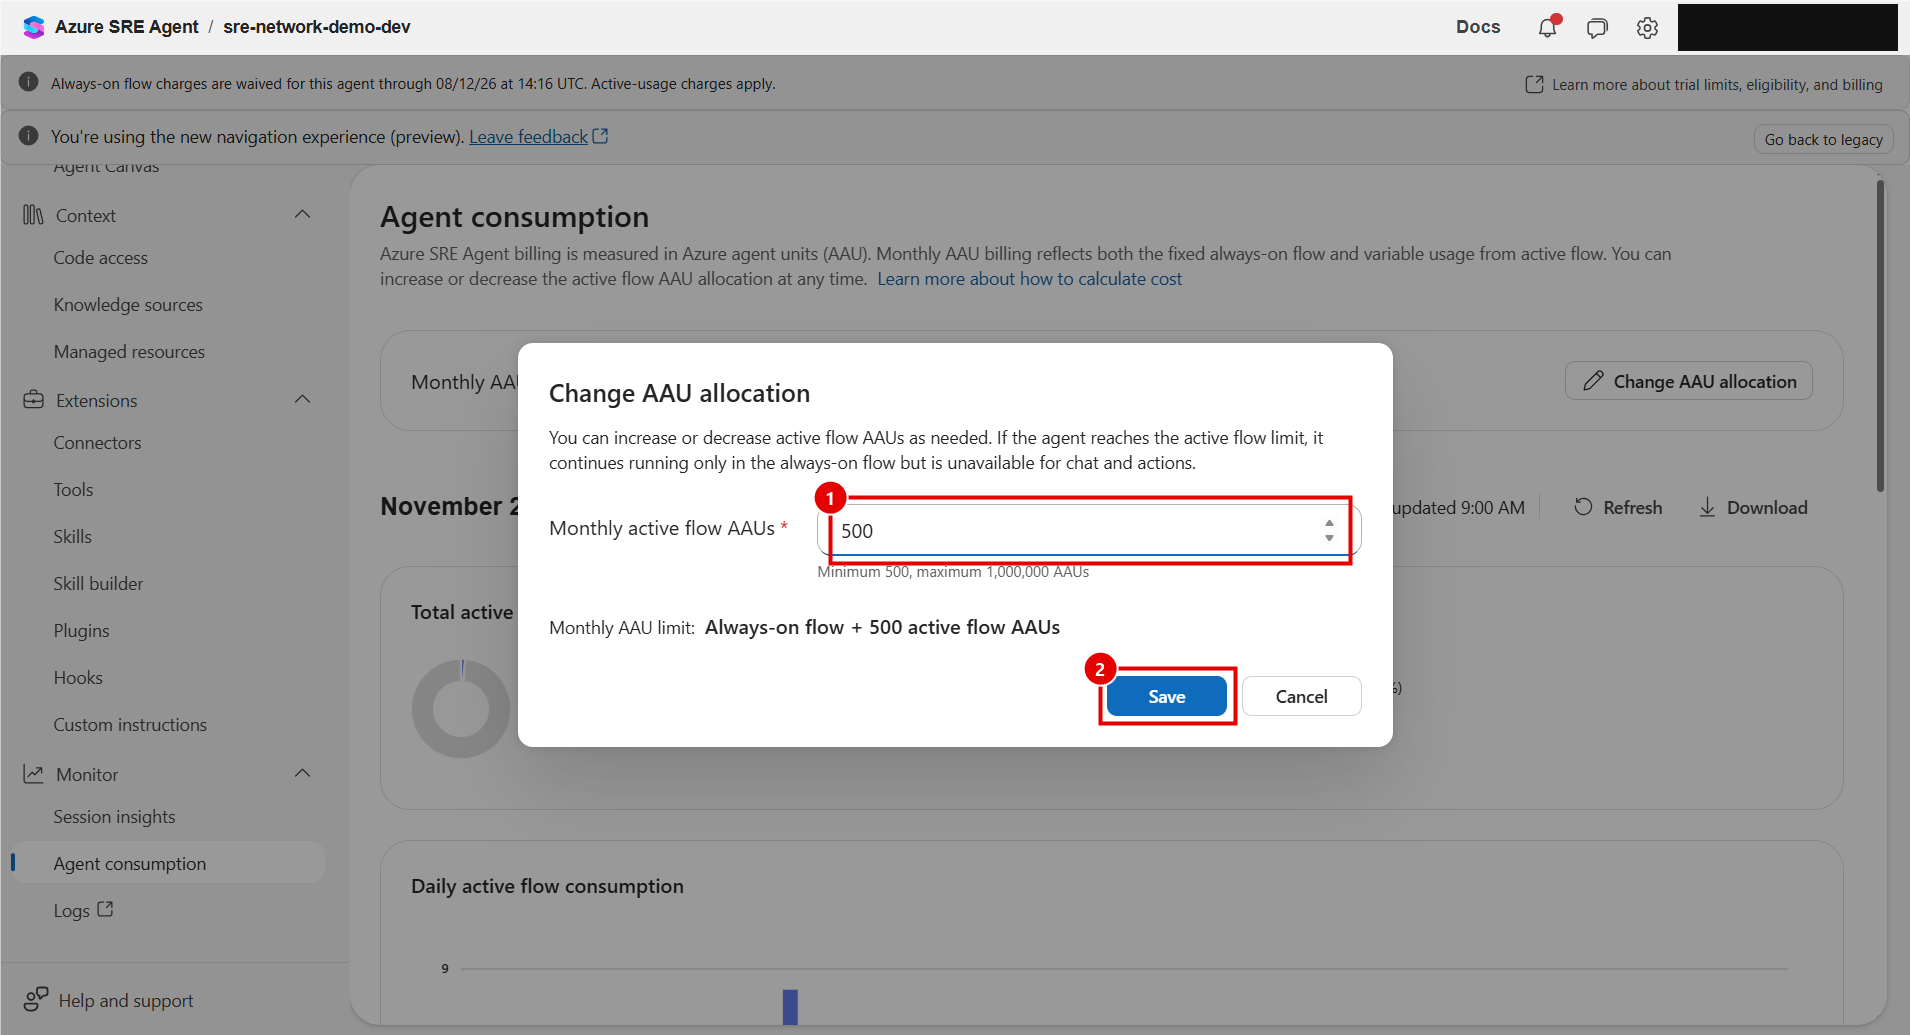
The page then read Always-on flow + 500 active flow AAUs. This caps active usage only; it does not stop the always-on charge or cap the rest of the environment. In this deployment, a banner also showed that always-on charges were waived for 30 days for the new agent, so active usage was the only agent cost.
The Investigation
The Prompt
We opened New chat and described only what an on-call engineer would know: the symptom, the error identifier, the approximate time and the fact that the pods look healthy. NetworkPolicy was not mentioned.
Users report that GET /api/status on the network-demo-frontend service in AKS cluster aks-sre-np-poc-dev (resource group rg-sre-np-poc-dev) started returning HTTP 502 with error UPSTREAM-CONNECTIVITY-001 at about 07:56 UTC today. The frontend and backend pods look healthy. Please investigate the root cause using read-only checks only. Do not change anything; if you identify a fix, propose it for my approval.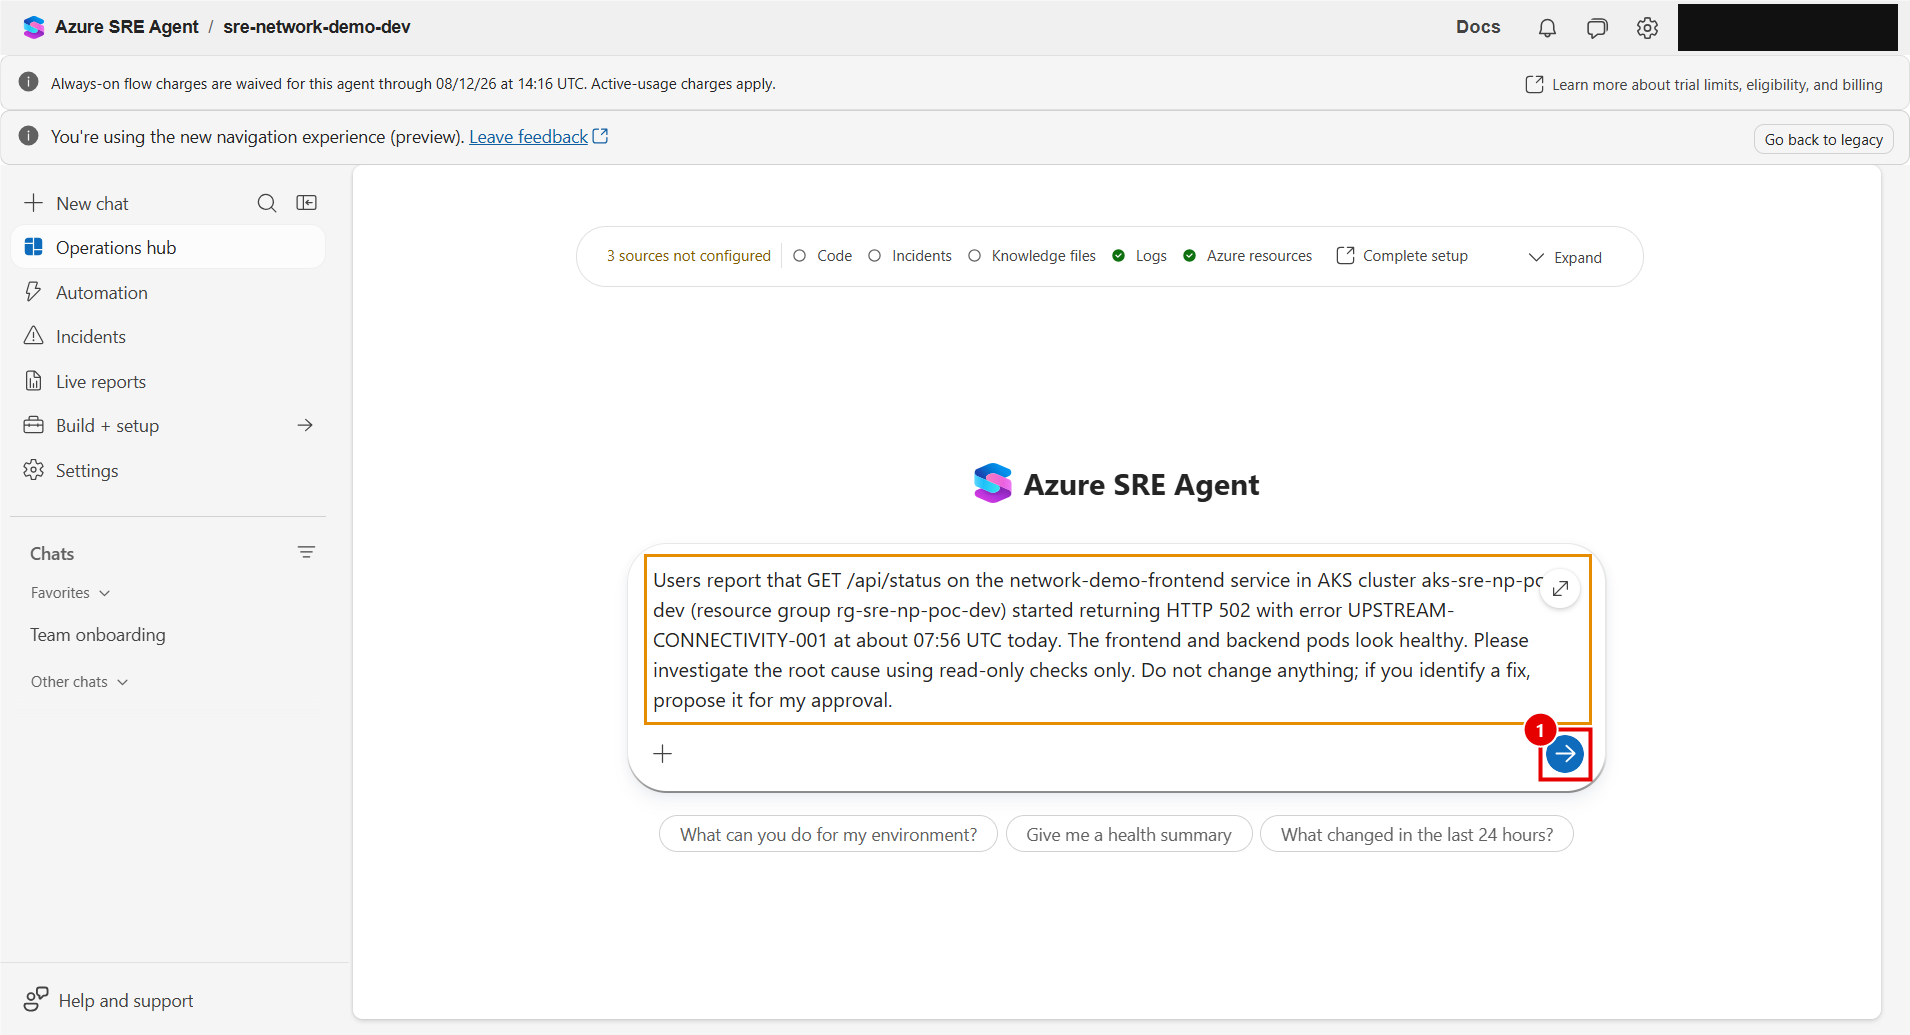
What the Agent Actually Did
Within a minute the agent stated a plan and started running tools. In order, it read:
- the Azure Activity Log for the cluster over the last two hours;
- kubectl get pods,svc,deploy -A to see the workloads;
- kubectl logs for both the frontend and the backend;
- kubectl get networkpolicies -A, then ingress, EndpointSlices and the frontend's environment variables, to confirm which backend URL the frontend calls.
Each tool call is labelled Safe or Medium risk and runs through a read-only RunKubectlReadCommand tool. After those first checks, it wrote:
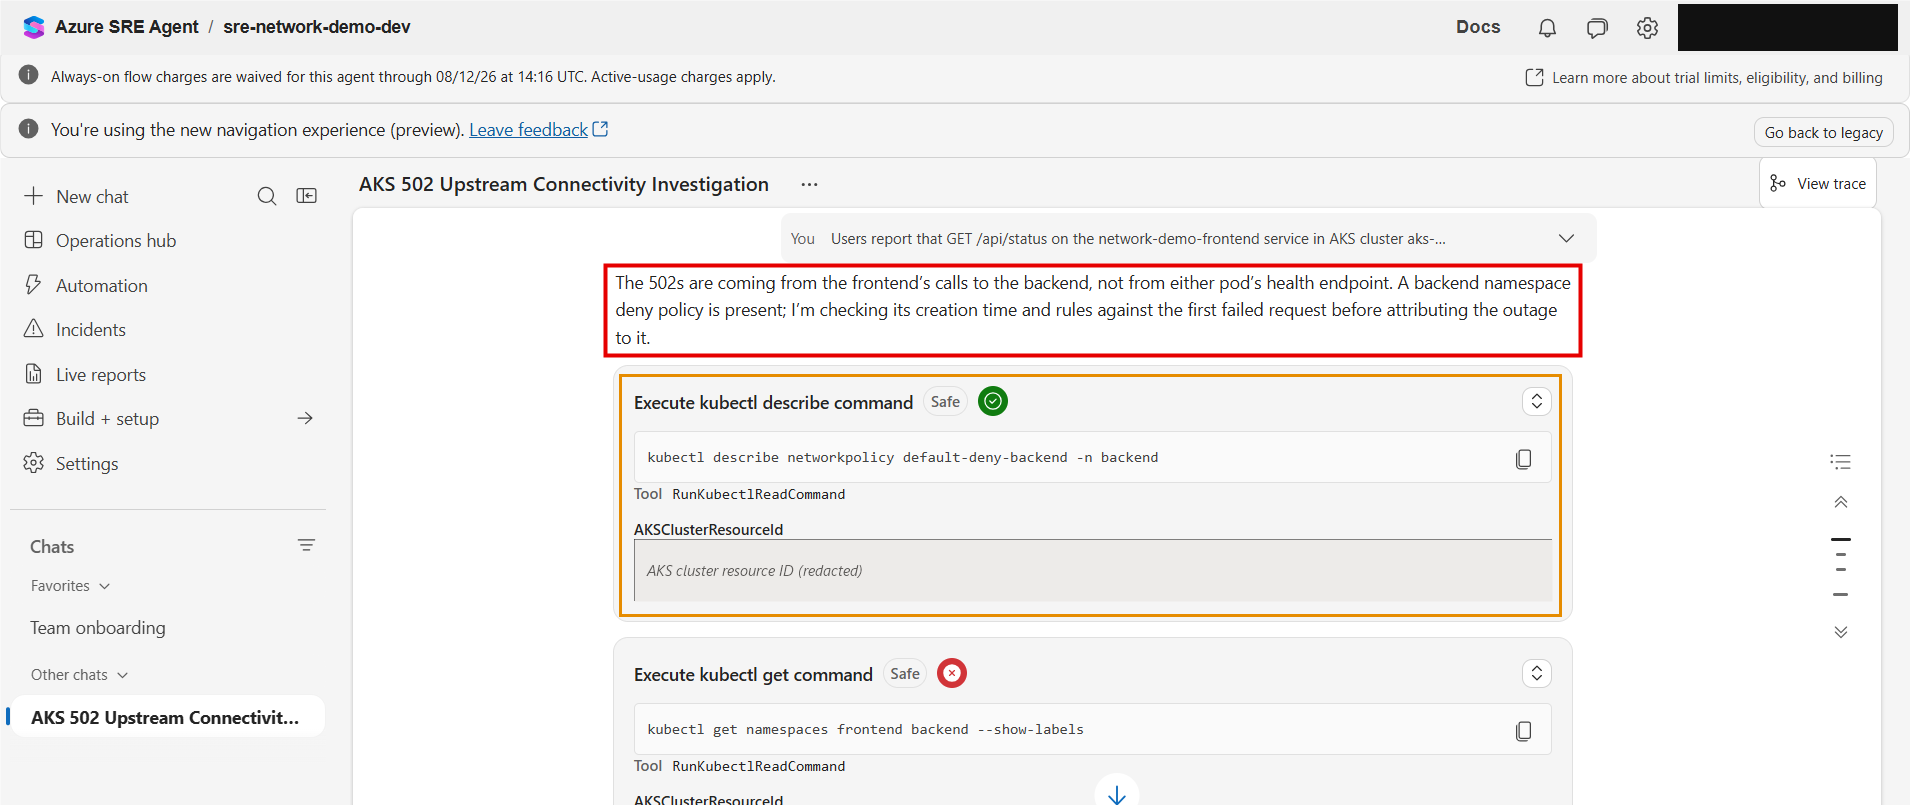
This is the step that separates the agent from a simple pattern matcher. It had already seen the deny policy, but it did not jump to it. It stated that it would compare the policy's creation time with the first failed request before attributing the outage to it. It then described the policy, read the namespace labels and checked the Cilium agent logs on the node.
Where It Hit Its Permission Boundary
The agent then tried two more reads: Cilium's own policy objects (ciliumnetworkpolicies) and per-endpoint policy state (ciliumendpoints). Both are custom resources that AKS RBAC Reader does not cover, so they failed under the managed identity. The agent paused and offered to re-run them with the operator's credentials through on-behalf-of (OBO) delegation.
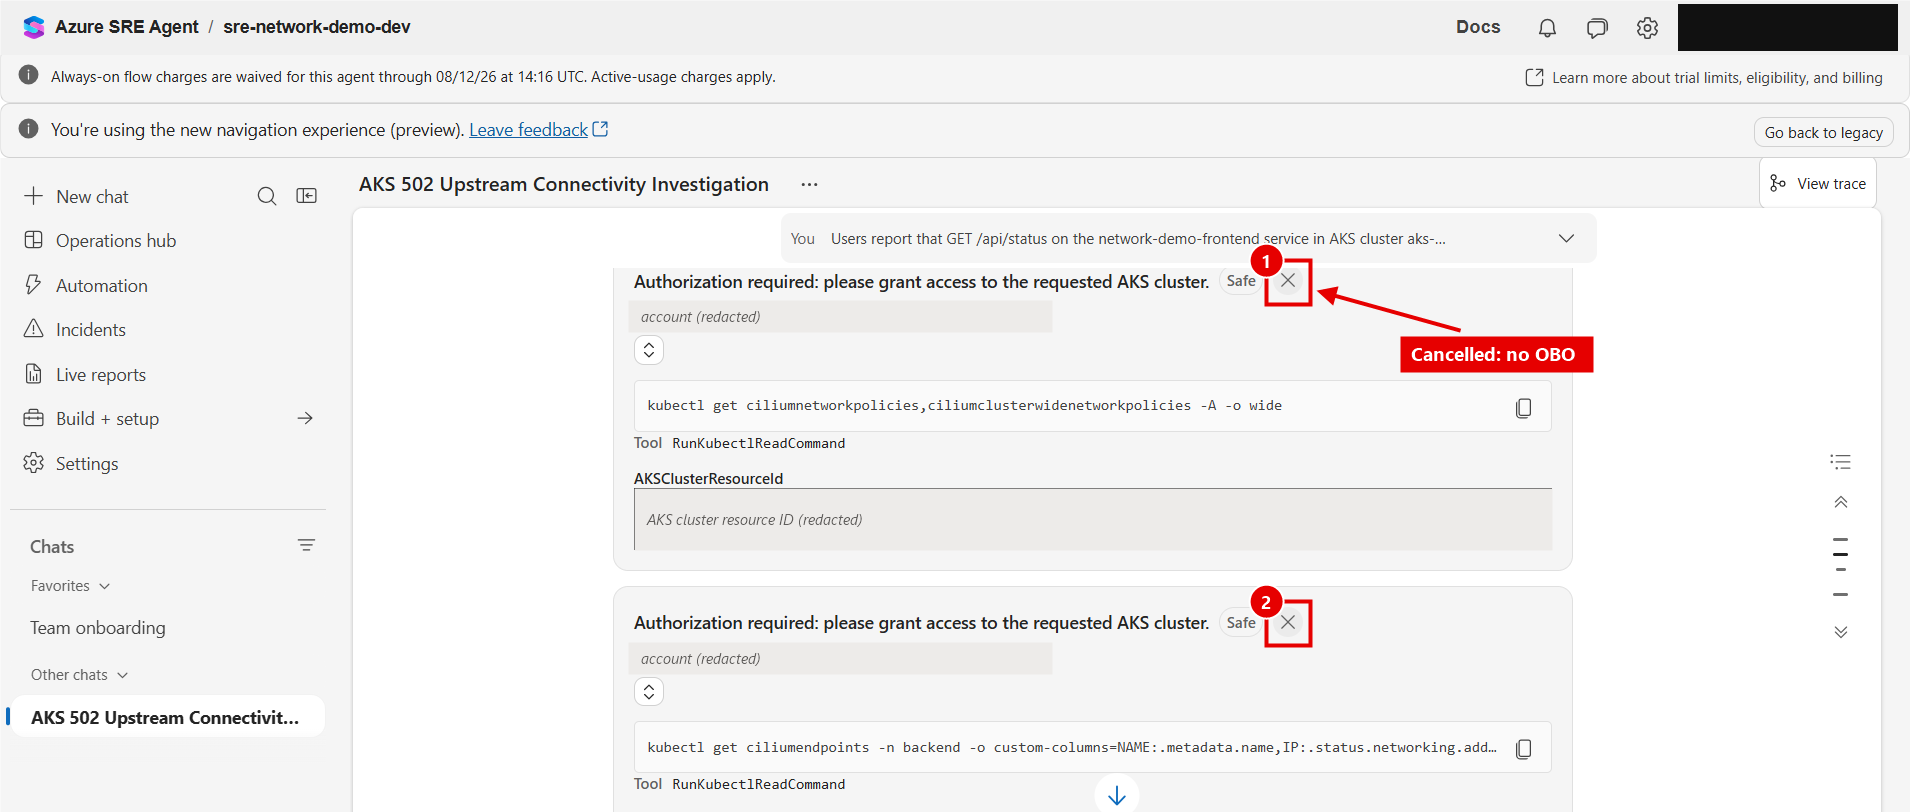
We declined both. OBO would let the agent act with the operator's rights instead of its own scoped identity, which a read-only investigation should not need. We said so and asked it to conclude with the evidence it had.
The Conclusion
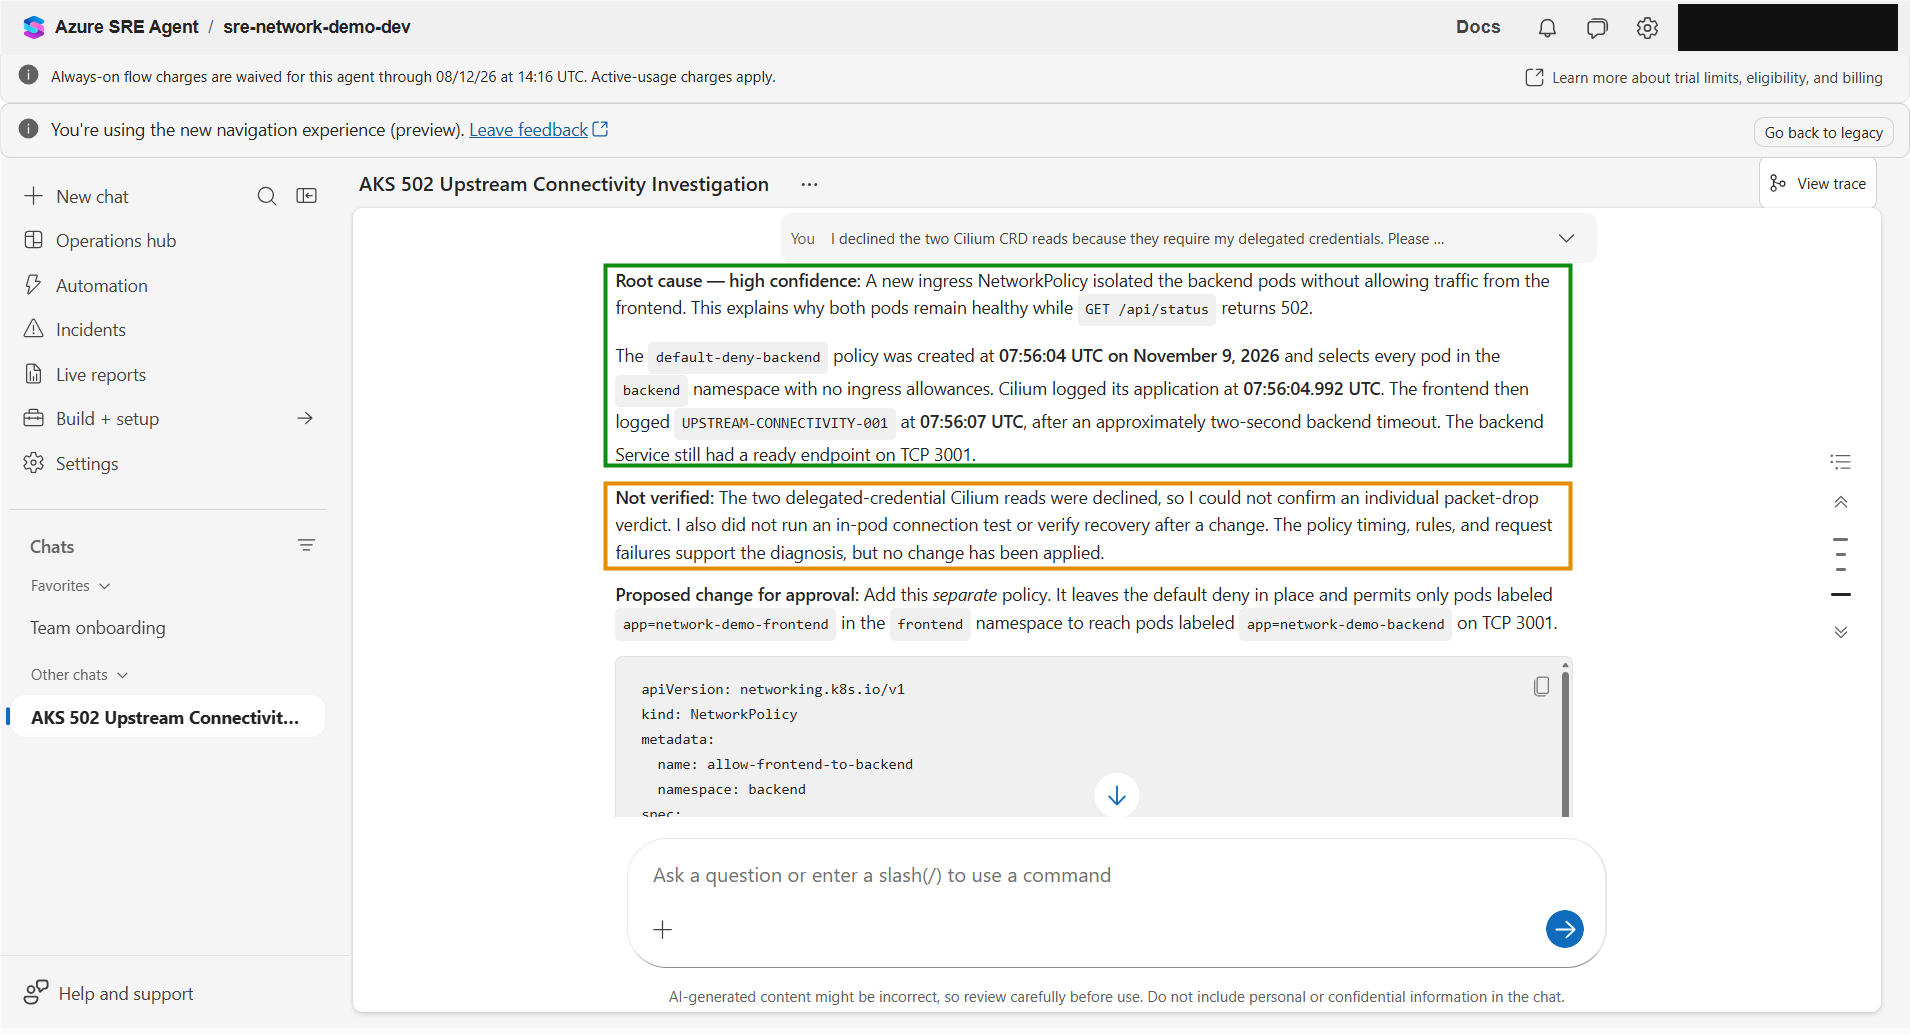
The agent identified the cause with high confidence, and its evidence is a proper timeline rather than a guess:
| Time (UTC) | Event | Source |
|---|---|---|
| 07:56:04 | default-deny-backend created, selecting all backend pods with no ingress allowed | Kubernetes object |
| 07:56:04.992 | Cilium logs the policy being applied | Cilium agent log |
| 07:56:07 | Frontend logs UPSTREAM-CONNECTIVITY-001 after a two-second timeout | Frontend container log |
It also noted that the backend Service still had a ready endpoint on TCP 3001, which rules out a missing or unready backend.
Just as useful was its Not verified paragraph. Because the delegated reads were declined, it said it could not confirm an individual packet-drop verdict, had not run an in-pod connection test and had not verified recovery. That is the transparency you want from an investigation tool: a strong conclusion, with the gaps named.
The Proposed Fix
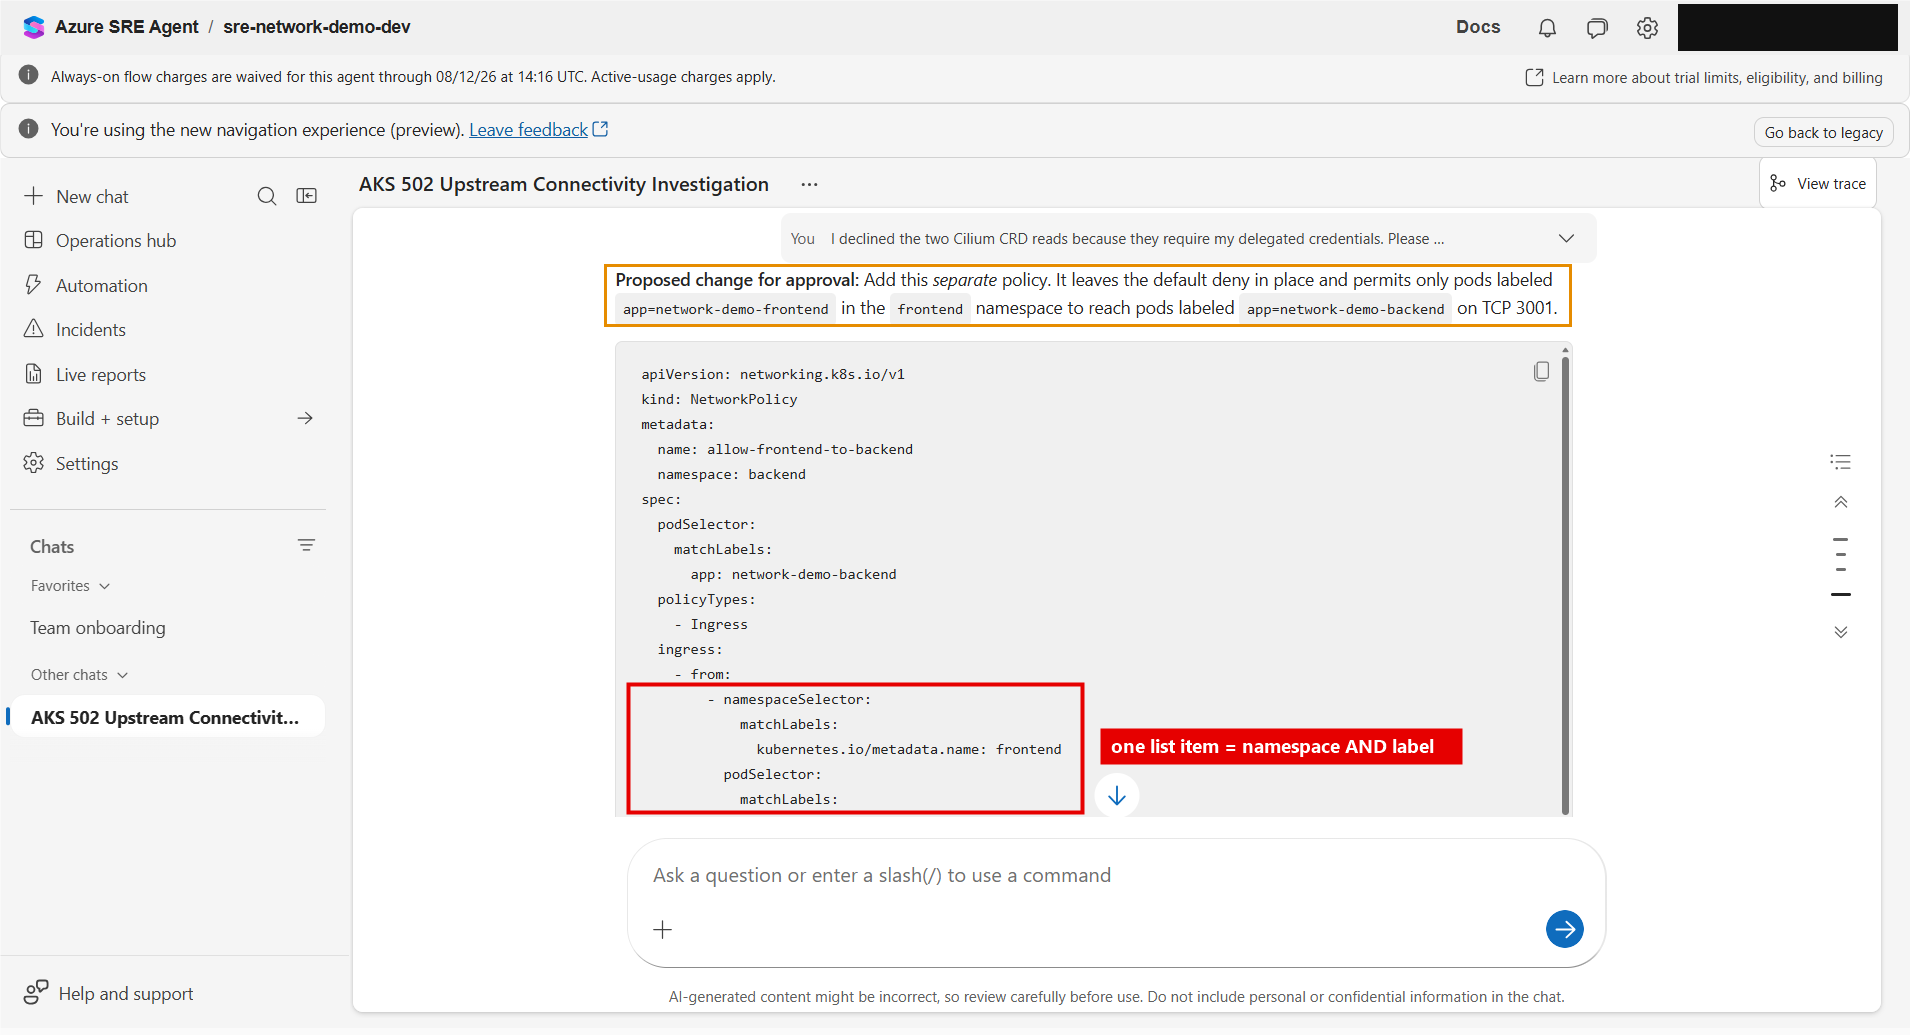
The proposal was the smallest correct change. It does not delete the deny policy; it adds a second policy that allows one source to reach one port:
Manifest file: poc-source/kubernetes/allow-frontend-backend.yaml
apiVersion: networking.k8s.io/v1
kind: NetworkPolicy
metadata:
  name: allow-frontend-to-backend
  namespace: backend
spec:
  podSelector:
    matchLabels:
      app: network-demo-backend
  policyTypes:
    - Ingress
  ingress:
    - from:
        - namespaceSelector:
            matchLabels:
              kubernetes.io/metadata.name: frontend
          podSelector:
            matchLabels:
              app: network-demo-frontend
      ports:
        - protocol: TCP
          port: 3001
Look closely at the indentation under from. namespaceSelector and podSelector are in the same list item, so a source must match both. Had they been two separate items, each starting with a dash, the rule would mean either: any pod in the frontend namespace, or any pod labelled network-demo-frontend in any namespace. That one dash is the difference between a narrow fix and a wide hole, and the negative tests below are designed to catch exactly that mistake.
Approving and Verifying the Fix
A Human Decision, Then One Command
The agent ran in Review mode, which means it proposes actions and does not apply them on its own, and its Kubernetes access was Reader-level. Its Azure identity still held Monitoring Contributor on the resource group from the wizard, so the read-only boundary here came from Review mode and the Kubernetes reader roles, not from the Azure role alone. We reviewed the exact YAML above, approved it and applied it from Cloud Shell with script 06.
Script file: poc-source/scripts/06-apply-mitigation.ps1
$ErrorActionPreference = 'Stop'
$SourceRoot = Split-Path $PSScriptRoot -Parent

$Applied = (Get-Date).ToUniversalTime().ToString('o')
kubectl apply --filename (Join-Path $SourceRoot 'kubernetes/allow-frontend-backend.yaml')
if ($LASTEXITCODE -ne 0) { throw 'Allow policy was not applied.' }
"MITIGATION_APPLIED_UTC=$Applied"

kubectl get networkpolicies --namespace backend
The policy was applied at 08:13:02 UTC, about ten minutes after the investigation started.
Recovery
Script 04 ran again eight seconds later, with a fresh TCP connection so that nothing opened before the change could mask the result:
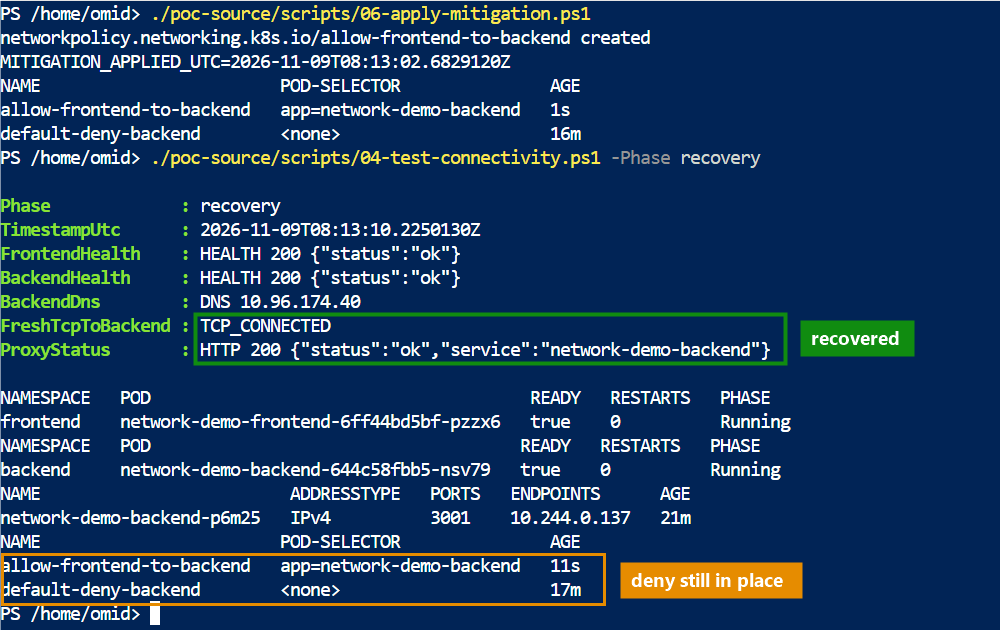
The proxy returns HTTP 200 again. Look at the last two lines: both policies exist. The default deny is still in force, and recovery comes only from the targeted allow rule.
Script 07: Prove Nothing Else Was Opened
Recovery proves that the allow rule works. It does not prove that the rule is narrow. For that, two deliberately wrong sources try the same connection:
| Source pod | Namespace | App label | Must be |
|---|---|---|---|
| wrong-app-label | frontend (correct) | network-demo-wrong-label (wrong) | Blocked |
| wrong-namespace | unauthorized (wrong) | network-demo-frontend (correct) | Blocked |
| The real frontend | frontend | network-demo-frontend | Allowed |
The test pods reuse the frontend image, so they have the same Python runtime, and neither uses host networking, so the test really exercises pod-to-pod policy.
Script file: poc-source/scripts/07-negative-tests.ps1
. (Join-Path $PSScriptRoot '00-variables.ps1')

$RegistryServer = az acr show --name $RegistryName --query loginServer --output tsv
(Get-Content (Join-Path $SourceRoot 'kubernetes/negative-test-pods.yaml') -Raw).Replace('REGISTRY_FQDN', $RegistryServer) |
    kubectl apply --filename -
if ($LASTEXITCODE -ne 0) { throw 'Negative-test pods were not created.' }

kubectl wait --for=condition=Ready pod/wrong-app-label --namespace frontend --timeout=120s
kubectl wait --for=condition=Ready pod/wrong-namespace --namespace unauthorized --timeout=120s
if ($LASTEXITCODE -ne 0) { throw 'Negative-test pods are not ready.' }

$TcpProbe = @'
import socket
try:
    socket.create_connection(("network-demo-backend.backend.svc.cluster.local", 3001), timeout=3).close()
    print("TCP_CONNECTED")
except OSError as error:
    print("TCP_FAILED", type(error).__name__)
'@

foreach ($Source in @(
    @{ Namespace = 'frontend'; Pod = 'wrong-app-label'; Expected = 'TCP_FAILED' },
    @{ Namespace = 'unauthorized'; Pod = 'wrong-namespace'; Expected = 'TCP_FAILED' },
    @{ Namespace = 'frontend'; Pod = 'deployment/network-demo-frontend'; Expected = 'TCP_CONNECTED' }
)) {
    $Labels = if ($Source.Pod -like 'deployment/*') { 'app=network-demo-frontend' } else {
        kubectl get pod $Source.Pod --namespace $Source.Namespace --output jsonpath='{.metadata.labels.app}'
    }
    $Result = ((kubectl exec --namespace $Source.Namespace $Source.Pod -- python -c $TcpProbe 2>&1) -join ' ').Trim()
    [pscustomobject]@{
        SourceNamespace = $Source.Namespace
        SourcePod = $Source.Pod
        AppLabel = $Labels
        Result = $Result
        AsExpected = $Result.StartsWith($Source.Expected)
    }
}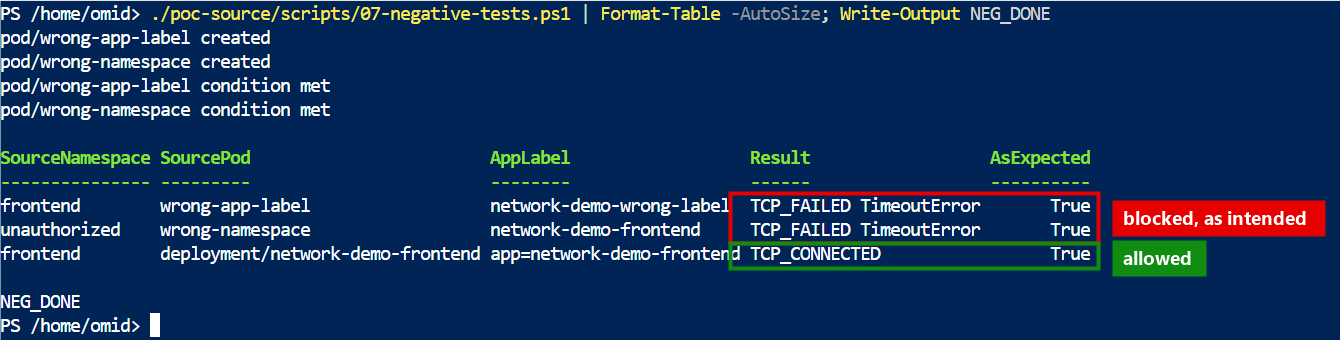
All three rows read AsExpected: True. A correctly labelled pod in the wrong namespace is blocked, a pod in the right namespace with the wrong label is blocked, and the real frontend connects. The rule really is namespace AND label.
Script 08: The Same Story in Container Insights
Finally, the incident as the platform recorded it independently. The frontend writes one JSON line per dependency call, Container Insights stores it in the ContainerLogV2 table, and a short KQL query counts the outcomes per minute.
Script file: poc-source/scripts/08-query-logs.ps1
. (Join-Path $PSScriptRoot '00-variables.ps1')

# The query command ships in a preview CLI extension; install it once without prompting.
az extension add --name log-analytics --allow-preview true --only-show-errors

$WorkspaceId = az monitor log-analytics workspace list `
    --resource-group $ResourceGroup --query '[0].customerId' --output tsv
if (-not $WorkspaceId) { throw 'Log Analytics workspace not found.' }

# ContainerLogV2 stores each JSON log line from the frontend in LogMessage.
$Query = @'
ContainerLogV2
| where TimeGenerated > ago(2h)
| where PodNamespace == "frontend" and ContainerName == "frontend"
| extend Event = tostring(LogMessage.event), ErrorId = tostring(LogMessage.error_id)
| where Event startswith "dependency"
| summarize Requests = count() by bin(TimeGenerated, 1m), Event, ErrorId
| order by TimeGenerated asc
'@

az monitor log-analytics query `
    --workspace $WorkspaceId `
    --analytics-query $Query `
    --query "[].{Minute:TimeGenerated, Event:Event, ErrorId:ErrorId, Requests:Requests}" `
    --output table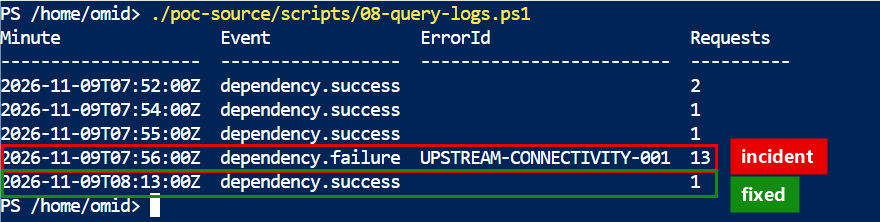
Successes up to 07:55, thirteen failures in the 07:56 minute (the burst of twelve plus the follow-up check), and success again at 08:13 after the fix. That matches the agent's timeline and our own test output.
Decommissioning and Key Takeaways
Decommissioning
Deleting the resource group removes everything inside it, and AKS removes its node resource group together with the cluster. The script deletes the agent first, explicitly, because only deleting it ends the always-on charge. Re-run the two az group exists checks until both return false, and look at Cost Management a day later, because cost data arrives with a delay.
Script file: poc-source/scripts/09-cleanup.ps1
. (Join-Path $PSScriptRoot '00-variables.ps1')

# Deleting the agent ends its always-on billing; stopping it does not.
$AgentId = az resource list --resource-group $ResourceGroup `
    --resource-type 'Microsoft.App/agents' --query '[0].id' --output tsv
if ($AgentId) {
    az resource delete --ids $AgentId
}

# Deleting the lab group also removes the AKS-managed node resource group.
az group delete --name $ResourceGroup --yes --no-wait

Write-Output 'Deletion requested. Re-run the checks below until both return false.'
az group exists --name $ResourceGroup
az group exists --name $NodeResourceGroup
In our latest run the node resource group was gone about two minutes after the deletion request, and the lab group about eight minutes after it. Instead of re-running the checks by hand, this loop waits until both are deleted:
PowerShell commands: wait until both resource groups are deleted
. ~/poc-source/scripts/00-variables.ps1
do {
    $Lab = az group exists --name $ResourceGroup
    $Nodes = az group exists --name $NodeResourceGroup
    "$(Get-Date -Format HH:mm:ss)  lab=$Lab  nodes=$Nodes"
    if ($Lab -eq 'true' -or $Nodes -eq 'true') { Start-Sleep -Seconds 30 }
} while ($Lab -eq 'true' -or $Nodes -eq 'true')
'Both resource groups are deleted.'
Key Takeaways
Health checks answer a smaller question than they appear to. Both pods were Ready, with zero restarts and healthy endpoints, for the entire incident. Monitoring built only on pod health would have stayed green. The signal that mattered was the dependency call, which is why the frontend logs its own outcome with a stable error identifier.
A timeout and a refusal tell different stories. A fresh connection that times out while DNS and endpoints are healthy points at the network path, not the application. Testing each layer separately, from inside the pod, is what made that visible.
The agent was most useful as a disciplined correlator. It did not know the answer in advance. It gathered logs, configuration and the Activity Log, noticed the policy, and checked the timing before blaming it. Its root cause rested on three timestamps from three independent sources, and it said clearly what it could not verify.
Permission boundaries show up in practice, not on paper. "Reader" meant a specific list of roles, including one unrelated to this environment, and it still did not cover Cilium's custom resources. When the agent reached that boundary it asked for the operator's credentials. Declining was the right call, and the conclusion was still strong without them.
A fix is not finished until you test what it should still block. Removing the deny policy would also have "fixed" the 502s. The additive rule plus two negative tests proved that only the intended path was opened.
Defaults deserve a review. The wizard picked an unrelated resource group when the subscription changed, the identity received Monitoring Contributor, the workspace had no ingestion cap, the active-usage limit started at 10,000 AAU, and the onboarding chat used AAUs before the first question. None of these is wrong, but each should be a conscious decision before the agent goes anywhere near production.
The Whole Flow in Six Steps
1. Baseline (07:55). Every layer passes from inside the pod, and the proxy returns HTTP 200.
2. Fault (07:56). One default-deny ingress policy: the pods stay Ready, and every request returns 502.
3. Investigation (08:03). A symptom-only prompt; the agent runs read-only checks across logs, configuration and the Activity Log.
4. Root cause (about 08:06). The deny policy, confirmed by three independent timestamps, with delegated reads declined.
5. Approved fix (08:13). A human-approved, additive allow rule restores HTTP 200 while the deny stays in place.
6. Proof. Negative tests show that the wrong label and the wrong namespace are still blocked, and Container Insights tells the same story.
If your pods look healthy and your users disagree, start with the dependency path, not the pod list. If you want help applying this approach to your own AKS platform, get in touch.